Home / Labour Statistics / Top / Table ( Reference 1 2 3 4 5 6 7 8 9 10 11 12 13 14 15 16 17 18 19 )

(Attachment)

Results of the Report on the Employment Situations (as of June 1, 2004)


1. Outline of places of business that conducted reporting and foreign laborers
(1)Totals (Table 1)
  The results of the recent survey (as of June 1, 2004) were tabulated from reports submitted by places of business that employ foreign laborers directly (hereinafter, "direct employment") or in which foreign laborers work through labor dispatch, contracting, etc. (hereinafter, "indirect employment").  This fiscal year, 145,346 places of business were asked to submit reports (a decrease of 5.6% compared to the previous year).  A total of 90,623 places of business (including places of business that do not employ foreign laborers) submitted reports (increase of 16.9%).  Of these, 24,678 either directly or indirectly employ foreign laborers (increase of 6.6%).  The share of places of business employing foreign laborers among all submitting places of business was 27.2% (decrease from 29.9% in the previous year).

(2)Direct employment (Tables 2 and 3)
  A total of 22,127 places of business reported that they directly employ foreign laborers.  These places of business reported that the number of foreign laborers in their employ was 179,966.
i.By industry
  Looking at the number of places of business and number of foreign laborers by industry, "manufacturing" had the highest in both categories, with 11,188 places of business (composition ration of 50.6%) and 103,234 laborers (57.4%).  Following were "services, N.E.C." with 2,526 places (11.4%) and 18,567 laborers (10.3%), "wholesale and retail trade" with 2,496 places (11.3%) and 12,592 laborers (7.0%), "education, learning support" with 1,124 places (5.1%) and 16,794 laborers (9.3%), and "eating and drinking places, accommodations" with 1,041 places (4.7%) and 12,723 laborers (7.1%).  These top five categories made up approximately 80% of all places of business and approximately 90% of all foreign laborers (Chart 1).
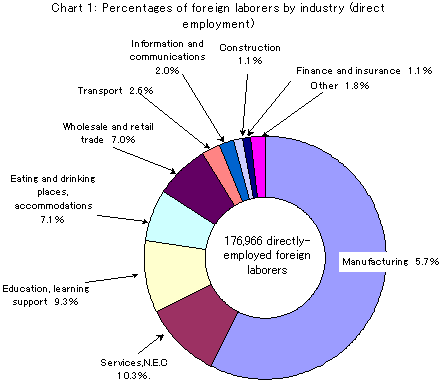
Chart 1: Percentages of foreign laborers by industry (direct employment)

  Taking a look at "manufacturing" from among these categories, there were high numbers of foreign laborers in such sub-categories as "manufacture of transportation equipment" (1,306 places of business [composition ratio in "manufacturing" of 11.7%] with 28,060 foreign laborers [27.2%]), "manufacture of food, beverages, etc." (1,782 places [15.9%], 18,626 laborers [18.0%]), "manufacture of electrical machinery, equipment, and supplies" (1,053 places [9.4%], 9,308 laborers [9.0%]), and "manufacture of apparel and other finished products made from fabrics and similar materials" (1,550 places [13.9%], 10,186 laborers [9.9%]).

  The highest numbers of foreign laborers were also reported in "information services" in the "information and communications" industry (773 places of business [composition ratio in "information and communications" of 83.2%] with 2,946 foreign laborers [82.5%]), "general eating and drinking places" of the "eating and drinking places, accommodations" industry (550 places of business [composition ratio in "eating and drinking places, accommodations" of 52.8%] with 10,380 foreign laborers [81.6%]), "school education" of the "education, learning support" industry  (947 places of business [composition ratio in "education, learning support" of 84.3%] with 12,665 foreign laborers [75.4%]), and "miscellaneous business services" of the "services, N.E.C." industry (965 places of business [composition ratio in "services, N.E.C." of 38.2%] with 9,761 foreign laborers [52.6%]).

ii.By size of place of business
  In terms of size of place of business, two categories made up approximately 50% of all places of business and foreign laborers.  These were "100 to 299 people", which had 6,344 places (composition ratio of 28.7%) and 54,416 foreign laborers (30.2%), and "50 to 99 people", which had 5,472 places (24.7%) and 26,638 laborers (14.8%) (Chart 2).

iii.Number of foreign laborers per place of business
  The average number of foreign laborers per place of business (number of foreign laborers divided by number of places of business) was 8.1 laborers (7.6 laborers in the previous year).
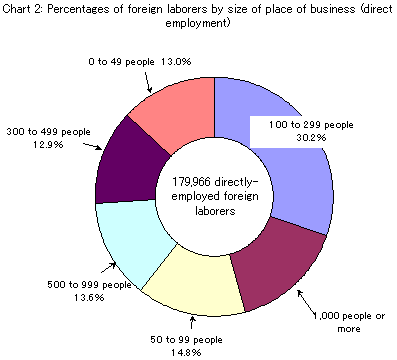
Chart 2: Percentages of foreign laborers by size of place of business (direct employment)

2. Characteristics of directly-employed foreign laborers
(1)By gender (Table 4)
  In terms of gender, 99,946 of the foreign laborers were men (composition ratio of 55.5%), and 80,020 were women (44.5%).

(2)By region of origin (Table 4)
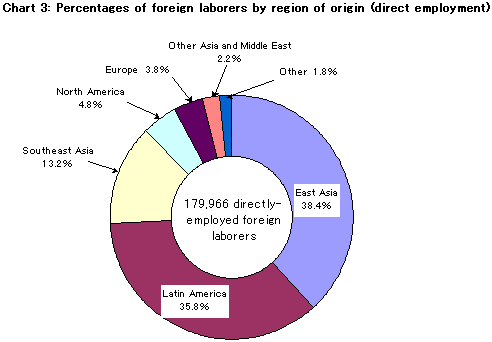
  Looking at foreign laborers by region of origin, the region with the highest number was "East Asia" with 69,078 laborers (composition ratio of 38.4%).  This was followed by "Latin America" with 64,405 (35.8%) and "Southeast Asia" with 23,770 (13.2%).  This marked the first time since the survey was initiated in 1993 that the number of foreign laborers from "East Asia" surpassed those from "Latin America" (Chart 3).  It should be noted that, of those from the "Latin America" region, the number of foreign laborers of Japanese descent was 57,301.  This figure represents 89.0% of all foreign laborers from Latin America.

Chart 3: Percentages of foreign laborers by region of origin (direct employment)

Reference: Countries that are included in the "regions of origin" used here:
East Asia: China (including Hong Kong, etc.), South Korea
Southeast Asia: The Philippines, Thailand, Vietnam, Indonesia, Malaysia, Myanmar, Cambodia, Laos, Singapore, Brunei
Other Asia and Middle East:India, Bangladesh, Pakistan, Sri Lanka, Nepal, Mongolia, Iran, Turkey, Israel, etc.
North America:United States, Canada
Latin America:Brazil, Peru, Bolivia, Argentina, Colombia, Paraguay, Mexico, Chile, etc.
Europe:United Kingdom, France, Russia, Germany, Romania, Italy, Ukraine, Spain, Ireland, Sweden, Holland, Switzerland, Poland, etc.
Other:The African countries (Ghana, Nigeria, Egypt, etc.) and the countries of Oceania (Australia, New Zealand, etc.)

(3)By status of residence (Table 4)
  Looking at foreign laborers by status of residence, 94,860 people (composition ratio: 52.7%) had status as "spouse or child of Japanese national", "spouse or child of permanent resident", or "long-term resident" that place no limitations on employment (hereinafter, "no limitations on employment", such as persons of Japanese descent, a figure that made up approximately half of the total.  Following this were 34,143 people (19.0%) in so-called "laborers in specialized or technical fields" (hereinafter, "specialized or technical fields"), which allow employment within a certain sphere.  These two categories combined accounted for approximately three-fourths of the total.
  Looking at "specialized or technical fields", 20,432 people (composition ration of 59.8% of "specialized or technical fields") had either "skilled labor" or "specialist in humanities/international services" as their status of residence.

Reference: "Laborers in specialized or technical fields" applies to laborers who have the following statuses of residence: instruction, art, religion, reporting, investment and management, law, accounting administration, medical care, research, education, technology, humanities and international services, intra-company transfer, entertainment, and skills.

(4)By vocation (Table 4)
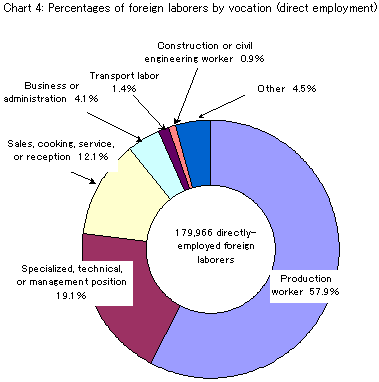
  Looking at foreign laborers by vocation, the most (104,235) were in "production worker" (composition ratio of 57.9%).  This was followed by 34,292 people (19.1%) in "specialized, technical, or management position" and 21,694 people (12.1%) in "sales, cooking, service, or reception".  These three vocations accounted for approximately 90% of all foreign laborers (Chart 4).

  All three of these vocations showed increases compared to the previous year; however, "specialized, technical, or management position" and "sales, cooking, service, or reception" in particular had high increases of 22.4% and 21.5%, respectively, compared to the previous year.

Chart 4: Percentages of foreign laborers by vocation (direct employment)

(5)Percentage of regular employees by vocation (Tables 5 and 6)
  Looking at the percentage of directly-employed foreign laborers that are employed as regular employees (hereinafter, "percentage of regular employees", 24.5% of the total were regular employees, which represented a decrease compared to the previous year (25.8%).  Here, "regular employee" refers to a person who is employed under an employment contract that does not have a set time limit, and whose designated work hours per day or per week are not less than those of an ordinary laborer.  Accordingly, approximately 70% of foreign laborers had an employment period stipulated in their employment contracts or had set designated work hours that were shorter than those of ordinary laborers.
  Looking at foreign laborers who were regular employees by vocation, "business or administration" (percentage of regular employees: 68.9%) and "specialized, technical, or management position" (52.6%) had the highest percentages of regular employees, while "sales, cooking, service, or reception" (6.1%) and "production worker" (17.0%) represented the low end.
  Furthermore looking at the foreign laborers who were regular employees by industry, "services, N.E.C." had a percentage of regular employees of 32.2%, followed by "education, learning support" with 27.6%, "wholesale and retail trade" with 25.4%, and "manufacturing" with 20.9%.  "Eating and drinking places, accommodations" had a low figure with 7.6%.  Even when looked at by industrial category, "business or administration" and "specialized, technical, or management position" each generally had high percentages of regular employees.
  Looking at places of business by size, the "50 to 99 people" category had 28.4%, which is a relatively high percentage of regular employees.

3. Characteristics of directly-employed foreign laborers by industry and size of place of business
(1)Characteristics by industry (Table 7)
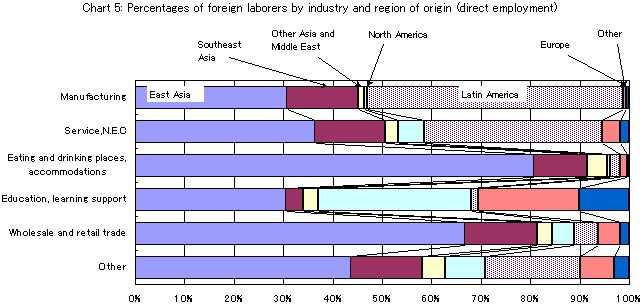
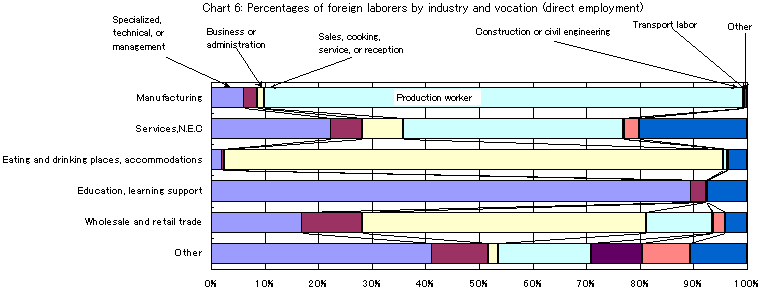
  Looking at foreign laborers by industry, people from "Latin America" in "manufacturing" numbered 53,496, which accounted for 51.8% of foreign laborers in this sector.  In terms of status of residence, those with "no limitations on employment" status numbered 69,148 (composition ratio of 67.0%) had the highest share, while in terms of vocation, those that were "production workers" had the highest share with 92,183 (89.3%).
  In "services", foreign laborers from "East Asia" (6,738 people; composition ratio of 36.3%) and "Latin America" (6,701; 36.1%) were the most common.  In terms of status of residence, those with "no limitations on employment" status numbered 10,964 (59.1%) had the highest share, while in terms of vocation, those that were "production workers" had the highest share with 7,614 (41.0%).
  In "eating and drinking places, accommodations", foreign laborers from "East Asia" had an 80.5% share with 10,239.  In terms of status of residence, those with "overseas study or school attendance (part-time job)" statuses numbered 8,682 (composition ration of 68.2%) had the highest share, while in terms of vocation, those that were employed in "sales, cooking, service, or reception" had the highest share with 11,831 (93.0%).

Chart 5: Percentages of foreign laborers by industry and region of origin (direct employment)

  In "education, learning support", foreign laborers from "North America" had a 30.9% share with 5,190.  In terms of status of residence, those with "specialized or technical fields" status numbered 11,350 (composition ration of 67.6%) had the highest share, while in terms of vocation, those that were employed in "specialized, technical, or management position" had the highest share with 15,005 (89.3%).
  In "wholesale and retail trade", foreign laborers from "East Asia" had a 66.6% share with 8,391.  In terms of status of residence, those with "overseas study or school attendance (part-time job)" status (5,071; composition ratio of 40.3%) and "no limitations on employment" (3,874, 30.8%) had the largest shares, while in terms of vocation, those that were employed in "sales, cooking, service, or reception" had the largest share with 6,683 (53.1%) (Charts 5 and 6).

Chart 6: Percentages of foreign laborers by industry and vocation (direct employment)

(2)Characteristics by size of place of business (Table 8)
  In principle, this report assumes that public employment security offices ask all places of business having 50 or more employees to submit reports and ask places of business having 49 or less employees to submit reports in accordance with regional conditions and administrative necessity.  Based on this point, the following will be limited to places of business with 50 employees or more so that a close inspection of the characteristics of foreign laborers by size of place of business can be conducted.
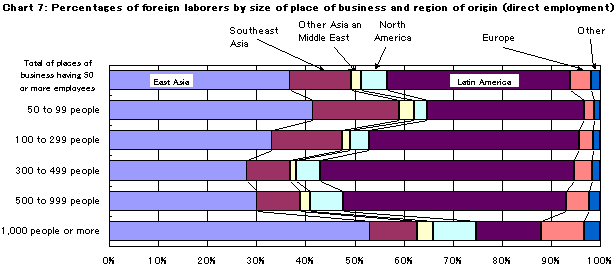
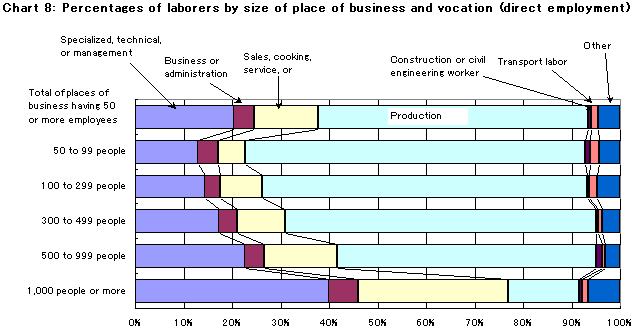
  Places of business that had between "50 and 99 people" had 17% of the total of foreign laborers for all places of business having 50 or more employees.  Looking at this number by region of origin, "East Asia" (composition ratio of 41.3%) and "Southeast Asia (17.9%) had higher percentages compared to the totals for places of business having 50 or more employees ("East Asia": 36.7%, "Southeast Asia": 12.5%).  Looking at status of residence, those with "specific activities (technical trainee)" (21.7%) had a higher percentage compared to the total for all places of business having 50 or more employees (9.2%).  Looking at vocation, "production worker" (70.1%) had a composition ratio that was higher than the total for all places of business having 50 or more employees (55.7%).
  Places of business that had between "100 and 299 people" had 34.8% of the total of foreign laborers for all places of business having 50 or more employees, meaning it had the larges number of foreign laborers.  Looking at this category, "Latin America" (composition ratio of 42.8%) in region of origin, "no limitations on employment" (62.0%) in status of residence, and "production worker" (67.1%) in vocation had higher shares the than the totals for all places of business having 50 or more employees ("Latin America": 37.4%, "no limitations on employment": 54.3%, and "production worker": 55.7%).
  On the other hand, looking at places of business that had "1,000 people or more", the share of "East Asia" (composition ratio of 52.9%) among regions of origin was higher than the total for all places of business having 50 employees or more (36.7%), while "Latin America" (13.3%) had a low share compared to the total for places of business having 50 employees or more (37.4%).  Looking at status of residence, while "specialized or technical fields" (38.6%) and "overseas study or school attendance (part-time job)" (31.2%) had higher shares compared to the totals for all places of business having 50 or more employees (20.1% and 15.5%, respectively), "no limitations on employment" (26.8%) was low compared to the total for all places of business having 50 employees or more (54.3%).  Looking at vocation, while "specialized, technical, or management position" (39.7%) and "sales, cooking, service, or reception" (30.8%) had higher shares compared to the totals for all places of business having 50 or more employees (20.3%% and 13.3%, respectively), "production worker" (14.7%) was low compared to the total for all places of business having 50 or more employees (55.7%).
  An obvious trend emerges in which, the larger the size of the place of business, the lower the shares of "specific activities (technical trainee)" and "production worker", and the higher the shares of persons from "North America" and "Europe" as well as "specialized or technical fields", "overseas study or school attendance (part-time job)", and "specialized, technical, or management position" (Charts 7 and 8).

Chart 7: Percentages of foreign laborers by size of place of business and region of origin (direct employment)


Chart 8: Percentages of laborers by size of place of business and vocation (direct employment)

4.Hiring and job separation of directly-hired foreign laborers (Table 9)
  Looking at employment and job separation over the past one year, the number of newly hired persons was 106,926, while the number of persons leaving their jobs was 81,345.  The "hiring rate" (i.e., the ratio of the number of persons hired through direct employment over the past one year [number of persons hired] against the number of directly-hired foreign laborers) was 59.4%, while the "job separation rate" (i.e., the ratio of the number of persons leaving their jobs over the past one year against the number of directly-employed foreign laborers) was 45.2%.  Thus, the "employment excess rate" (i.e., the ratio of new hires minus job separations over the past one year against the number of directly-employed foreign laborers) was 14.2%.  Each of the above showed increases of 1.3%, 1.0%, and 0.4%, respectively, compared to the previous year.

5.Employment of foreign laborers by places of business that primarily engage in labor dispatch or contracting (Tables 10 and 11)
  Of the 22,127 places of business that directly employ foreigners and the 179,966 foreign laborers, the number of places of business that primarily engage in labor dispatch and contracting (hereinafter, "dispatching and contracting places of business") was 2,035 and the number of related foreign laborers was 50,944.  These figures represent composition ratios of 9.2% and 28.3%, respectively; each being 0.6% and 1.5% lower than the previous year.  The average number of foreign laborers per place of business was 25.0, which is approximately four times higher than non-dispatching and contracting places of business (6.4).
  Looking at size of place of business, the highest numbers of both places of business and foreign laborers belonged to the "100 to 299 people" category, with 704 places of business (composition ratio of 34.6%) and 19,765 foreign laborers (38.8%).
  Furthermore, the highest numbers of foreign laborers that are directly employed by dispatching and contracting places of business by region of origin, status of residence, and vocation were, respectively, "Latin America" (41,002; composition ratio of 80.5%), "no limitations on employment" (46,084, 90.5%), and "production worker" (44,465, 87.3%).

6. Numbers of places of business and foreign laborers by region and their characteristics
(1)Characteristic by prefecture (Table 12)
i.Direct employment
  The highest numbers of places of business that directly employ foreign laborers belonged (in order) to Tokyo (4,858 places), Aichi Prefecture (1,582), Kanagawa Prefecture (1,374), Osaka Prefecture (1,300) and Shizuoka Prefecture (1,199).  The highest numbers of foreign laborers (in order) were Tokyo (33,815 laborers), Aichi Prefecture (24,077), Shizuoka Prefecture (17,603), Kanagawa Prefecture (10,451), and Osaka Prefecture (9,849).  In both cases, the top five prefectures made up approximately 50% of the total.
  Looking at the number of foreign laborers by status of residence, Tokyo had the highest number of those having "specialized or technical fields" status (14,568), and Aichi Prefecture (18,814) and Shizuoka Prefecture (15,071) had the highest numbers of those having "no limitations on employment" status.

ii.Indirect employment
  The numbers of indirectly-employed foreign laborers were highest (in order) in Aichi Prefecture (26,188), Shizuoka Prefecture (20,328), Nagano Prefecture (9,427), Mie Prefecture (9,086), and Gifu Prefecture (8,443).  Thus, the Tokai prefectures and neighboring prefectures accounted for the top five prefectures, and these prefectures accounted for over 50% of all indirectly-employed foreign laborers in Japan.

(2)Characteristics by block (Table 13)
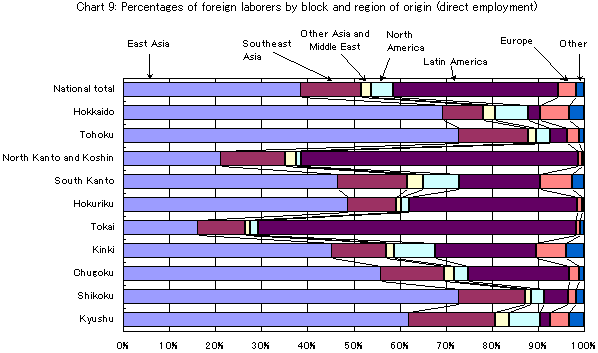
  Looking at the number of foreign laborers by block, the highest numbers belonged (in order) in "South Kanto", "Tokai", "Kinki", and "North Kanto and Koshin".
  Looking at "Tokai" and "North Kanto and Koshin" from among these, the highest numbers in terms of region of origin were "Latin America" (69.0%, and 60.1%, respectively), in terms of status of residence were "no limitation on employment" (77.6% and 77.3%), and in terms of vocation were "production worker" (82.7% and 83.2%).
  For "South Kanto" and "Kinki", high numbers in terms of region of origin were "East Asia" (46.3% and 45.0%, respectively); in terms of status of residence were "no limitation on employment" (42.8%, 38.5%), "specialized or technical fields" (32.1%, 29.7%), and "overseas study or school attendance (part-time job)" (21.0%, 19.0%); and in terms of vocation were "production worker" (31.1%, 42.7%), "specialized, technical, or management position" (29.0% , 33.2%), and "sales, cooking, service, or reception" (22.1%, 12.2%) (Chart 9).

Chart 9: Percentages of foreign laborers by block and region of origin (direct employment)

Reference: Here, "block" refers to the following:
  Hokkaido:Hokkaido
  Tohoku:Aomori, Iwate, Miyagi, Akita, Yamagata, Fukushima
  North Kanto & Koshin:Ibaraki, Tochigi, Gunma, Yamanashi, Nagano
  South Kanto:Saitama, Chiba, Tokyo, Kanagawa
  Hokuriku:Niigata, Toyama, Ishikawa, Fukui
  Tokai:Gifu, Shizuoka, Aichi, Mie
  Kinki:Shiga, Kyoto, Osaka, Hyogo, Nara, Wakayama
  Chugoku:Tottori, Shimane, Okayama, Hiroshima, Yamaguchi
  Shikoku:Tokushima, Kagawa, Ehime, Kochi
  Kyushu:Fukuoka, Saga, Nagasaki, Kumamoto, Oita, Miyazaki, Kagoshima, Okinawa

7.Places of business that plan to hire new foreign laborers in the next six months (Tables 14 and 15)
  Of the places of business that conducted reporting, the number of places of business that plan to hire new foreign laborers in the next months (hereinafter, "places of business planning to hire") was 3,743.  This represented 15.2% of the total.  Furthermore, looking at this number by industry, the highest numbers of places of business planning to hire were in "manufacturing" (2,325 places), "services, N.E.C" (365), and "wholesale and retail trade" (263).  In terms of prefecture, the highest numbers were in Tokyo (586 places), Aichi Prefecture (270 places), and Shizuoka Prefecture (229 places).

8.Indirect employment (Table 16)
  The number of places of business reporting that they indirectly employ foreign laborers (this includes "places of business that both directly and indirectly employ foreign laborers" and "places of business that only indirectly employ foreign laborers") was 5,135.  The number of foreign laborers employed at these places of business was 132,436.

i.By industry
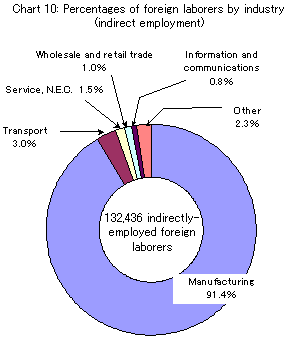
  Looking at individual industries, the numbers of places of business and of foreign laborers were highest for "manufacturing" (3,901 [composition ratio: 76.0%] and 121,076 [91.4%], respectively), thus making up the majority (Chart 10).

ii.By size of place of business
  Looking at places of business by size, the numbers of places of business (1,739 places; composition ratio of 33.9%) and of foreign laborers (45,753, 34.5%) were highest in the "100 to 299 people" category.

iii.No. of foreign laborers per place of business
  The average number of foreign laborers per place of business was 25.8 people (25.1 people in the previous year), and the average number for places of business having 50 or more employees was 29.9 (29.2 in previous year).

Chart 10: Percentages of foreign laborers by industry (indirect employment)

9.Trends in employment of foreign laborers over the past 10 years (Tables 17 18 19)
  Trends by industry, size of place of business, vocation, region of origin, and status of residence over the past 10 years as identified in this survey are shown in Tables 17 to 19.


Top Table ( Reference 1 2 3 4 5 6 7 8 9 10 11 12 13 14 15 16 17 18 19 )
Labour Statistics / Home