| HOME | 統計情報 | 前ページ | 次ページ |
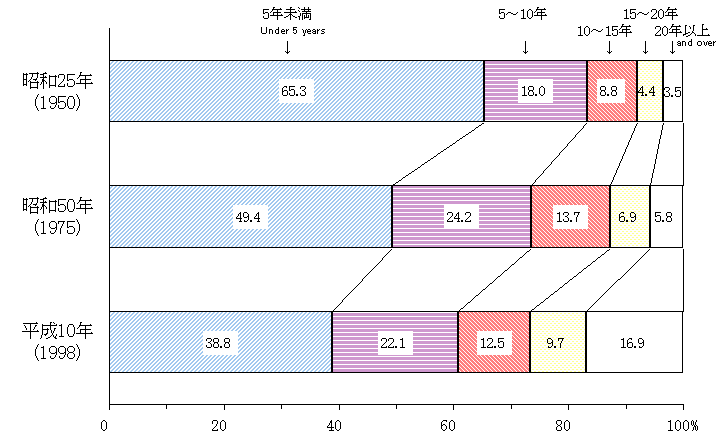
図 4-1 同居期間別にみた離婚件数構成割合の年次比較 −昭和25・50・平成10年−
Figure 4-1 Yearly comparison of percent distribution for divorces by duration of cohabitation ,1950,'75,'98
表4-1 同居期間別にみた離婚件数・構成割合及び平均同居期間の年次比較 −昭和25・50・平成10年−
Table 4-1. Yearly comparison of divorces, percent distribution by duration of cohabitation, and mean duration of marriage 1950,'75,'98
| 同居期間 Duration of marriage |
離婚件数 Divorces |
構成割合 Percent distribution(%) |
||||
| 昭和25年 (1950) |
50年 ('75) |
平成10年 ('98) |
昭和25年 (1950) |
50年 ('75) |
平成10年 ('98) |
|
| 総 数 Total | 83 689 | 119 135 | 243 183 | 100.0 | 100.0 | 100.0 |
| 5年未満 Under 5 years | 54 014 | 58 336 | 90 790 | 65.3 | 49.4 | 38.8 |
| 1 年 未満 | 14 255 | 14 773 | 16 791 | 17.2 | 12.5 | 7.2 |
| 1〜2年未満 | 15 272 | 13 014 | 20 989 | 18.5 | 11.0 | 9.0 |
| 2〜3年未満 | 11 661 | 11 731 | 19 986 | 14.1 | 9.9 | 8.5 |
| 3〜4年未満 | 7 956 | 10 141 | 17 738 | 9.6 | 8.6 | 7.6 |
| 4〜5年未満 | 4 870 | 8 677 | 15 286 | 5.9 | 7.3 | 6.5 |
| 5〜10年未満 | 14 871 | 28 597 | 51 661 | 18.0 | 24.2 | 22.1 |
| 10〜15年未満 | 7 285 | 16 206 | 29 315 | 8.8 | 13.7 | 12.5 |
| 15〜20年未満 | 3 655 | 8 172 | 22 596 | 4.4 | 6.9 | 9.7 |
| 20年以上 and over | 2 925 | 6 810 | 39 614 | 3.5 | 5.8 | 16.9 |
| 平均同居期間(年) Mean duration of cohabitation(years) |
5.3 | 7.1 | 10.2 | |||
| 注: | 1)離婚件数総数には同居期間不詳を含む。 |
| 2)同居期間不詳を除いた総数に対する構成割合である。 |
| Notes: | 1) The total number of divorces includes those which duration of cohabitation is not stated. |
| 2) In the percent distribution,divorces which duration of cohabitation is not stated are excluded from the total number of divorces. |
| HOME | 統計情報 | 前ページ | 次ページ |