| HOME | 統計情報 | 前ページ | 次ページ |
表 5-1 親権を行う子の有無別にみた離婚件数・構成割合・親が離婚した子ども数・20歳未満人口・親が離婚した子ども数の比率(20歳未満人口千対)の年次比較 −昭和25・30・35・40・45・50・55・60・平成2・7・10年−
Table 5-1 Yearly comparison by divorces, their proportion by presence of children , number of children involved, population under 20 years old and rate of children involved in divorce (per 1,000 population under 20 years old),1950,'55,'60,'65,'70,'75,'80,'85,'90,'95,'98
| 年 次 Year |
離婚件数 Divorces |
親権を行う子の有無 別離婚件数構成割合 Proportion of divorces by if children are involved or not(%) |
親が離婚し た子ども数 Number of children involved in divorce |
20歳未満人口 (各年10月1日 現在) Population under 20 years old (as of October 1 of each year) |
親が離婚した 子ども数の比 率(20歳未満 人口千対) Rate of children involved in divorce ( per 1,000 population under 20 years old) |
|||
| 子どもなし In case children are not involved |
子どもあり In case children are involved |
|||||||
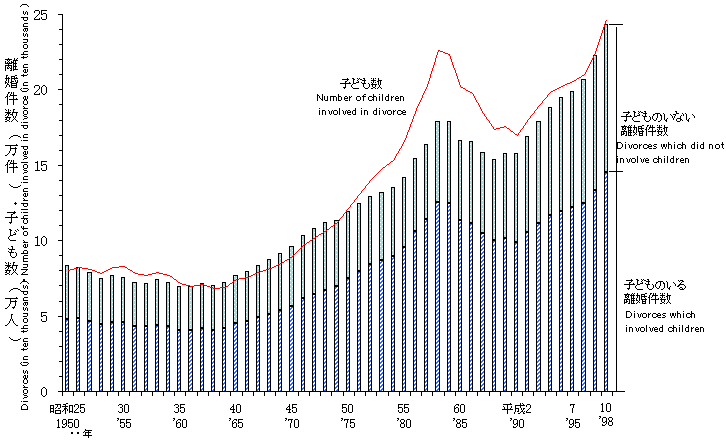
| 昭和25年 | 1950 | 83 689 | 42.7 | 57.3 | 80 481 | * | 37 995 707 | 2.12 |
| 30 | '55 | 75 267 | 39.3 | 60.7 | 83 138 | * | 38 423 669 | 2.16 |
| 35 | '60 | 69 410 | 41.7 | 58.3 | 71 339 | * | 37 375 144 | 1.91 |
| 40 | '65 | 77 195 | 41.8 | 58.2 | 74 412 | * | 36 018 070 | 2.07 |
| 45 | '70 | 95 937 | 40.9 | 59.1 | 89 687 | * | 33 643 771 | 2.67 |
| 50 | '75 | 119 135 | 37.3 | 62.7 | 121 223 | * | 34 927 141 | 3.47 |
| 55 | '80 | 141 689 | 32.4 | 67.6 | 166 096 | * | 35 540 652 | 4.67 |
| 60 | '85 | 166 640 | 31.8 | 68.2 | 202 585 | * | 34 784 961 | 5.82 |
| 平成2年 | '90 | 157 608 | 37.3 | 62.7 | 169 624 | * | 32 370 067 | 5.24 |
| 7 | '95 | 199 016 | 38.7 | 61.3 | 205 901 | * | 28 359 365 | 7.26 |
| 10 | '98 | 243 183 | 40.4 | 59.6 | 246 979 | 26 648 000 | 9.27 | |
| 注: | 1)*印は国勢調査結果である。 |
| 2)親が離婚した子ども数は10人以上は10人として計算した。 |
| Notes: | 1) The mark * shows the results of population censuses. |
| 2) The number of children involved in divorce is calculated as 10 even if it is over 10. |
図 5-1 親権を行う子の有無別にみた離婚件数と親が離婚した子ども数の年次推移 −昭和25年〜平成10年−
Figure 5-1 Trends in divorces classified by whether children are involved or not, and number of children involved ,1950-1998
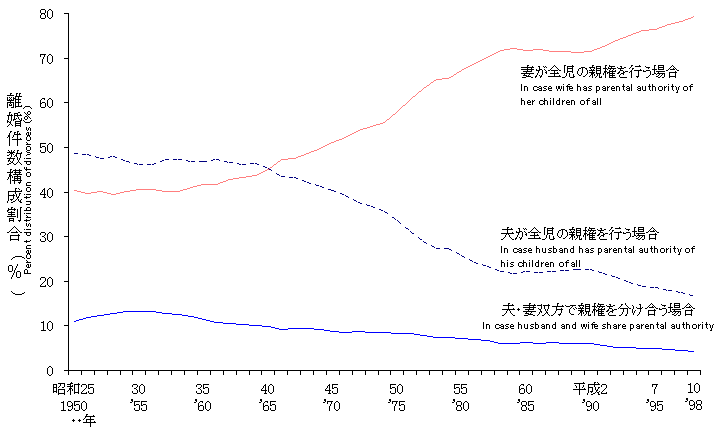
図 5-2 親権を行う者別にみた離婚件数構成割合の年次推移 −昭和25年〜平成10年−
Figure 5-2 Trends in percent distribution of divorces by husband or wife who has parental authority,1950-1998
| HOME | 統計情報 | 前ページ | 次ページ |