(Economic effects of social security)
As mentioned in Chapter 1, social security systems contribute to economic stabilization and economic growth. In this section, let us look at the specific economic effects of social security based on the data that can be shown in quantity such as the industrial scale and the effect on employment. It is, however, essentially difficult to express the effects of social security in quantity, including the mitigation of people's worries for their daily lives, of family burdens in childcare and long-term care, and of burdens of children in supporting their old parents, and the rapid return to the workplace after becoming ill. Despite the difficulty, it should not be forgotten that social security has meaningful effects on economy. As shown in the subtitle of the annual report on health and welfare for 1968 - 1969 published just 30 years ago, social security is a "basic condition for prosperity" to support economic stabilization and growth.
(Arguments concerning social security and economy)
Some people say social security systems support the society and economy while others say the increase of social security benefits and burdens may depress the economy(Note). Although there are various opinions about the influence of the increasing social security benefits and burdens on the economy expressed in various aspects, there have been no established theories so far. The following outlines the opinions in a simple manner.
(Note)
In the action plan for economic structural reform determined by the Cabinet in May of 1997, the government shows a concern that the increase of the burdens of the national and local governments in public fields including social security might depress the economy.
In addition to those described above, there are also different opinions about the relationship between the social security burdens and the international competitiveness of companies or about the relationship between the pay-as-you-go method adopted under the pension system and the accumulation of capital. At any rate, it is required to conduct more quantitative and demonstrative research about the relationship between social security benefits and burdens and economy, in addition to the traditional, qualitative discussions about the issue.
2. Industrial Scales of Social Security and Its Related Fields
(Industrial scales of the social security-related fields)
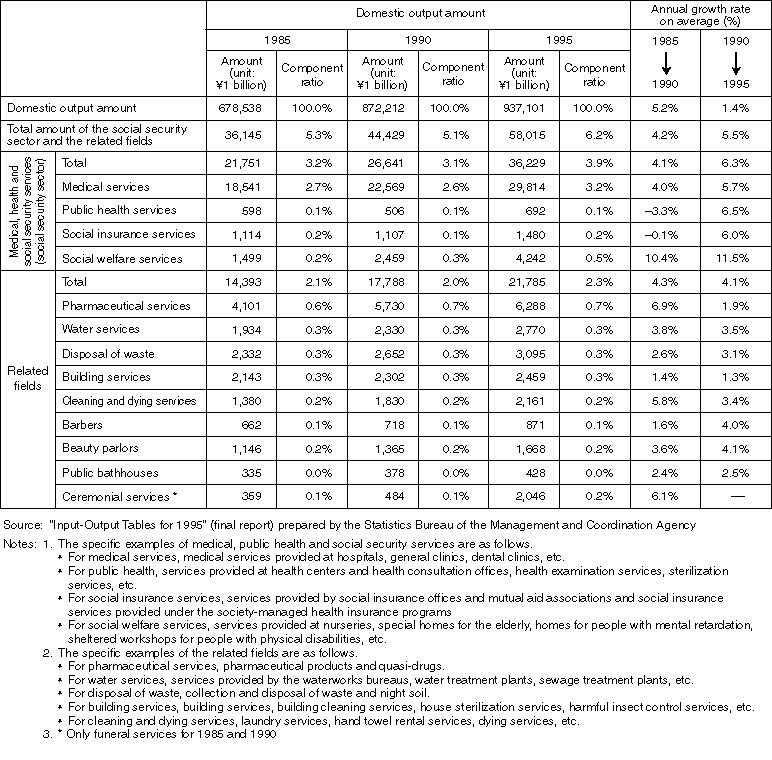
According to the inter-industry relations table of 1995, Japan's economic scale is about \937 trillion in the domestic output amount (total value of goods and services produced through domestic economic activities) and about \505 trillion in the gross amount of value added. (The gross amount of value added is calculated by deducting the amount of intermediate consumption such as of materials and fuels used for production from the domestic output amount. The value added is distributed to become corporate and household income.) The domestic output amount of the social security sector comprising medical, public health, social insurance and social welfare services (hereinafter "the social security sector") is about \36 trillion, accounting for 3.9% of the total. Together with the social security-related sector including pharmaceutical and waste disposal services, the domestic amount of the social security sector totals about \58 trillion, accounting for 6.2% of the total (Table 2-4-1).
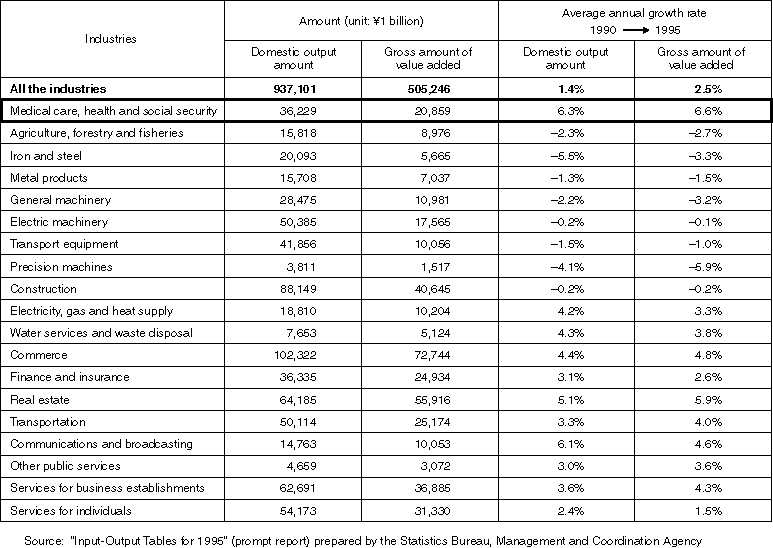
Comparing the social security sector with other industrial sectors, its domestic output amount far exceeds that of agriculture, forestry and fisheries (about \16 trillion). It is on the same level as the financial and insurance sector (about \36 trillion), and is twice as large as the domestic output amount of the sectors of general machinery (\11 trillion), and transport equipment, and communications and broadcasting (\10 trillion for each). Also compared with other industrial sectors, the domestic output amount of the social security sector is relatively large in scale. (Refer to the Column on the Industrial Scale of the Medical and Welfare Equipment.)
Table 2-4-1. Changes in the Domestic Output Amount of the Social Security Sector and of the
Social Security-related Fields

Column
In the aforementioned industrial scales of the social security sector and the related sectors, the output amounts of equipment required for the provision of social security services are not always considered. For example in the medical field, attention should be paid also to the manufacturing of electronics-applied machinery (X-ray equipment for medical services), and to the manufacturing of medical equipment and devices. Also in the welfare field, the output amount of the welfare-related devices is not considered in the industrial scale of the welfare sector.
According to the Survey of Pharmaceutical Industry Productions conducted by the Ministry of Health and Welfare, Japan's domestic shipment amount of medical devices amounted to about \1.9 trillion in 1997. Comparing this with the industrial shipment amount (about \323 trillion) shown in the Industrial Statistics prepared by the Ministry of International Trade and Industry, the shipment amount of medical devices account for about 0.6% of the industrial shipment amount. For the growth rates (compared with the previous year), however, medical devices showed the higher rate (4.7%) than that of manufactured products (industrial shipment amount) (3.2%) in 1997. Since 1993, the growth rates have been showing the same tendency.
According to the estimates made by the Ministry of International Trade and Industry, the market scale of the welfare device industry amounted to \1.179 trillion in fiscal 1997 on the shipment amount basis, showing the growth rate of about 8.0% compared with the previous year. For the breakdown, personal care related products (diapers and bathing-related products) amounted to \232.5 billion, communications devices (spectacles, hearing aids, etc.) to \257.3 billion, and artificial limbs and outfits to \197.5 billion.
The devices required in the welfare services are not always those prepared exclusively for people needing care or for care facilities. They are sometimes universal design products that anyone including people with disabilities, the elderly and people without disabilities can easily utilize. The market scale of welfare devices including these universal design products is estimated to be \2,004.9 billion for fiscal 1997.
|
(Growth rates of the industrial scales)
Based on the inter-industry relations table, the annual growth rates of the domestic output amount and the gross amount of value added of the social security sector were respectively 6.3% and 6.6% on average, for the period from 1990 to 1995. The growth rates far exceed the average annual growth rate of all the industries (1.4% for the domestic output amount and 2.5% for the gross amount of value added). The growth rates of the domestic output amounts of the social security-related sectors such as pharmaceuticals are also higher than the average of all the industries, showing the average annual growth rate of about 4.1% for the period from 1990 to 1995.
As explained above, the industrial scales of the social security sector and the related sectors are large and their growth rates are high. It can therefore be said that these industrial sectors are playing important roles in the national economy (Tables 2-4-1 and 2-4-2).
Table 2-4-2. Domestic Output Amount and Gross Amount of Value Added by Major Industries Shown in the
Inter-Industry Relations Table (For 1995)
3. Economic Effects of Social Security
3-1. Social Security's Effects on Output Amount
(Economic effect estimated based on an inter-industry relations table)
An inter-industry relations table not only shows the economic scales of certain industrial sectors but also indicates inter-industry relations in values. It is therefore possible to estimate diversified economic effects based on the table. Based on the figures shown in an inter-industry relations table, let us examine social security's effects on economy. (Refer to the Column on "Inter-industry Relations Table.")
Column
Current industries mutually deal with other industries and are inter-related in a complicated manner. Inter-industry relations tables quantitatively represent these inter-industry relations. The tables were developed by Dr. Leontief in 1936. Dr. Leontief, who deceased recently, was an American scholar and a winner of the Nobel Memorial Prize in Economic Science. Economists estimate that the tables were an attempt to apply the general equilibrium theory of L. Walras to real national economy and an attempt to create a "tableau economique" of F. Quesney for the American economy.
An inter-industry relations table is composed of columns and ranks. In the vertical direction (in the column), you can find the cost structure of a certain industry. (Cost for materials by industries, wages paid to employees, etc.) In the horizontal direction (in the rank), you can find to or by which industrial sectors the products or services of a certain industry were sold, exported or consumed.
In the United States, the Bureau of Labor Statistics created an inter-industry relations table targeting 1939 in 1944. The table was utilized for the postwar economic predictions and was highly estimated for its accuracy. Following this, inter-industry relations tables have been created all over the world, both in the countries of market economy and planned economy. According to the survey conducted by Japan's Statistics Bureau of the Management and Coordination Agency from 1995 to 1996, 49 countries including Japan have created inter-industry relations tables. In Japan, the Economic Planning Agency and the Ministry of International Trade and Industry independently created inter-industry relations tables for the first time for 1951. For the tables targeting 1955 and the updates, the preparation works have been conducted jointly by several agencies led by the present Management and Coordination Agency. Presently, 11 governmental agencies including the Ministry of Health and Welfare are participating in the preparation work, led by the Statistics Bureau of the Management and Coordination Agency. The latest tables are for 1995, and the final report was published this March. Inter-industry relations tables are also prepared targeting prefectures and cities designated by Cabinet orders.
The tables are utilized for economic forecasting or for the projection of policy effects. In addition to general economic forecasting and analysis of the effect of certain political measures, analyses can be made on diversified themes. For example, the economic effect of social security as dealt with in this annual report, the economic effect produced on the local economy when a home professional baseball team wins the championship, or the economic effect on the local community of the 2002 World Cup can be analyzed.
|
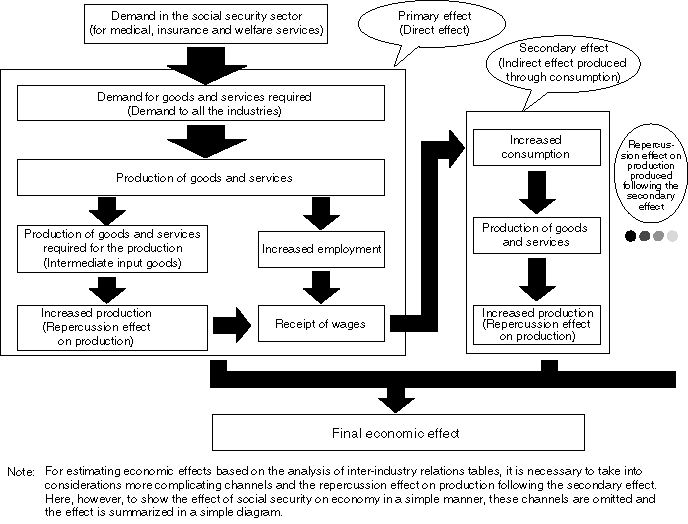
The increase in the demand to the social security sector will lead to the increase in the supply of services. Then new demands will be generated for goods and services required for the supply of the services, and all of the industrial sectors will be engaged in the production. Further demands will be created for materials and equipment required for the production to meet the new demands, and the production of these goods will increase. Through the repetition of this process, the increase in the demand to the social security sector will increase the output amount of all the industries. This is called the "primary effect."
As a result of the production activities, values are added in each of the industrial sectors and they are distributed to workers as income or reserved by companies. Households that have received the income spend money to purchase goods and services required for their living. In the industrial sectors, new production activities will be started to meet the demands from the households, and the production of materials and equipment to support the new production activities will increase. Thus the spending by households will lead to the increase in the output amount of the industries. This is called the "secondary effect."
These effects are produced in different ways depending upon the industries in which demands are generated. It is, however, clear that the scale of the primary effect is large for the industries utilizing more materials and equipment. On the contrary for the industries utilizing more labor force, the scale of the primary effect is small because the ratio of compensation of employees to the output amount is high in these industries, but the scale of the secondary effect is larger for these industries (Figure 2-4-3).
Figure 2-4-3. Social Security's Economic Effect (Conceptual diagram)
(Figures showing economic effects in the inter-industry relations table)
It is possible to verify the aforementioned effects by the use of an inter-industry relations table. However, before the verification, it is necessary to set certain conditions in advance including the ratio of the living expenditure to the income obtained through production activities. This ratio is important for the measurement of the secondary effect. Furthermore, as the characteristics of inter-industry relations tables, it is difficult to identify changes in the input of capital and labor force and in the production structure. It should be noted that the estimation of social security's effect on economy can be made only conditionally based on inter-industry relations tables.
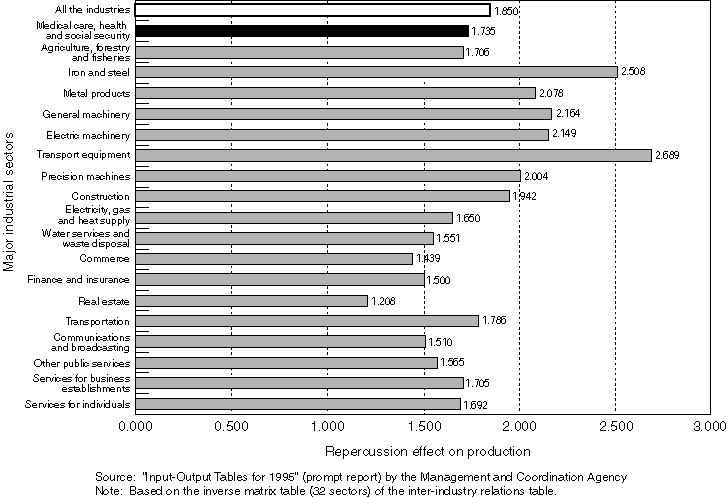
Figure 2-4-4 represents the repercussion effect on production shown in the "Input-Output Tables for 1995". According to the data, the average effect of all the industries is 1.850, which means that if the final demand increased by \100 billion, the output amount will directly increase by about \185 billion. The repercussion effect on production of the social security sector is 1.735, and the primary effect when the final demand increases by \100 billion will be about \173.5 billion, which stands comparison with the average level of all the industries (Figure 2-4-4).
Figure 2-4-4. Repercussion Effect on Production Shown in the Inter-industry Relations Table
(Prompt report for 1995)
Furthermore, because a lot of human resources are input in the social security sector, the ratio of wages to the output amount is high and it is expected that the living expenditure of households will increase. The secondary effect of the social security sector is estimated to be \60.6 billion and the total of the primary and secondary effects will be about \234.1 billion when the final demand increases by \100 billion.
As shown above, demands for new services in the social security sector can produce economic effects.
(Pension and economy)
The economic effects of social security are not limited to the investments to improve the social security-related services. For pension, the total amount of pension paid in fiscal 1997 was about \35 trillion, which account for about 9% of the disposable income of the household economy sector and about 12% of the final living expenditure (about \300 trillion) calculated based on the SNA. Furthermore, according to Figure 3-2-7, most of the consumption is financed with social security benefits such as pensions at households comprising old couples without jobs.
As explained above, public pensions provide financial resources for the consumption by the elderly, and they account for a certain percentage of consumption in the household economy sector in national economy. Public pensions are provided regularly according to the past payment of premiums regardless of the economic situations. Unlike stocks, the values of public pensions do not change greatly depending upon economic fluctuations. Besides the number of the elderly, who are major recipients of public pensions, does not rapidly change year by year. Therefore, about 20 million old people, to whom the public pensions are mainly provided, can become a stable group of "consumers."
Public pensions that support the consumption of beneficiaries such as the elderly are basically financed by the working generations. In the progress of aging, it is necessary not to impose excessive burdens on the working generations while noting the economic effect of public pensions.
3-2. Effect of Social Security on Employment
(Employment opportunities provided by social security)
Social security includes quite a wide range of fields: social insurance, public health and environmental sanitation as well as health, medical care and welfare.
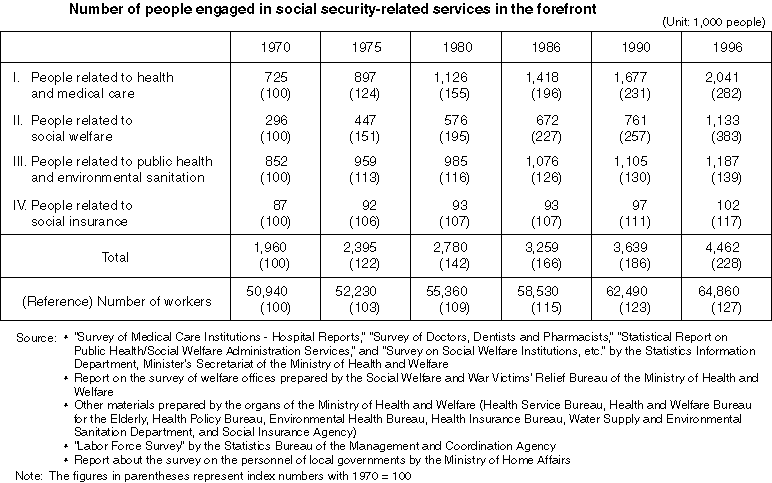
For the number of people working in these fields, there are about 4.46 million people working in the social security fields in total (for 1996). The increasing rate is higher than the increasing rate of all the workers. Presently one out of 15 workers is working in the social security fields (Table 2-4-5).
Table 2-4-5. People Engaged in the Social Security Fields (Estimates)
Among the social security-related fields, let us look at the changes in the number of people engaged in social services (health, medical care and welfare fields: refer to the Note 2 in Page 42). As shown in Figure 2-4-6, the number of people engaged in these fields was about 1 million in 1970. Since then the number has been steadily increasing and is 3.17 million in 1996, which accounts for about 4.9% of the total number of workers in Japan (64.86 million), steadily increasing from 2.0% in 1970.
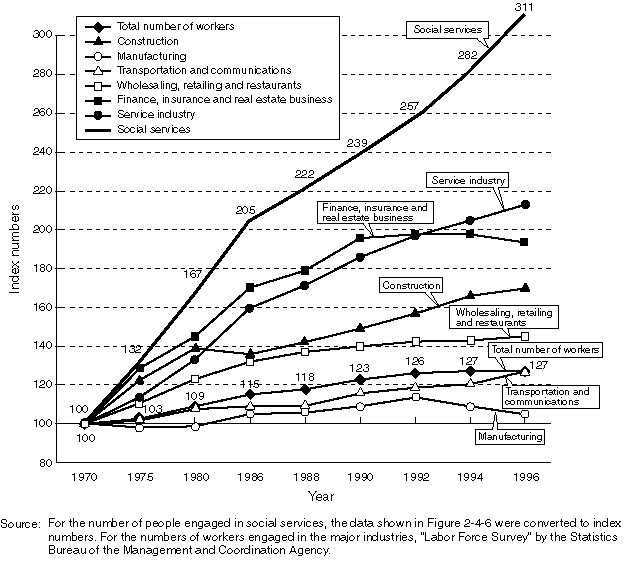
Comparing the number of people engaged in social services with the numbers of workers by major industries shown in the "Labor Force Survey," the number is less than half of the number of people engaged in construction (6.7 million). But it stands comparison with the number of people engaged in transportation and communications (4.11 million), or in finance, insurance and real estate business (2.56 million). It is twice as large as the number of people related to schools, such as teachers and staff working at elementary, junior high, and high schools (1.30 million, according to Basic Survey on Schools announced by the Ministry of Education).As shown in Figure 2-4-7, the number of people engaged in social services has been showing the growth rate that is higher than those of other services (Figure 2-4-7).
As described above, the social security fields provide large employment opportunities to workers and their growth rates are higher than those of other fields.
Figure 2-4-6. Changes in the Number of People Supporting Social Services
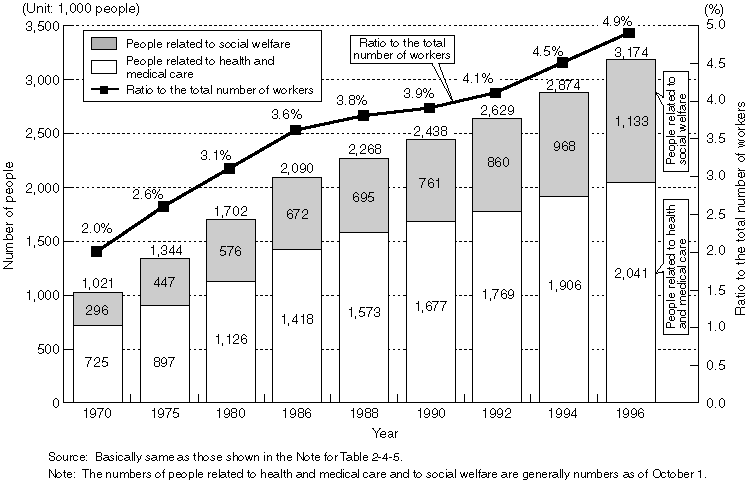
Figure 2-4-7. Comparison of the Growth Rate of the Number of People Engaged in Social Services with the Growth Rates of the Numbers of People Engaged in the Major Industries (Expressed as index numbers with 1970 = 100)
(Contribution of social security to the increase of employment opportunities)
In accordance with the activation of economic activities, the labor force required for the activities will also increase, and new job opportunities will be provided. The social security sector especially requires much labor force. For example if a special home for the elderly that accommodates 50 people is established, the home will require 23 workers. The establishment will provide more employment opportunities as the primary effect expected based on the inter-industry relations analysis and will produce the secondary effect on a large scale, which will also increase employment.
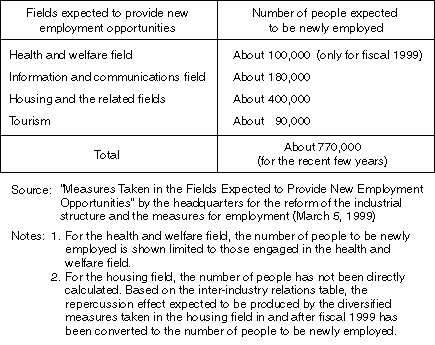
The government's headquarters for the reform of the industrial structure and the measures for employment lists the industrial fields that are expected to create new employment opportunities: the information and communications field; the housing and related fields; tourism; and the health and welfare field. In March 1999, estimations were made on the effect of the measures related to each of the fields would produce on employment. For the health and welfare field, it was estimated that about 100,000 jobs would be provided in fiscal 1999 only by the promotion of the New Gold Plan, the five-year projects such as the Urgent Day-care Measures, and of the Government Action Plan for People with Disabilities. For the breakdown, the New Gold Plan will provide jobs to about 80,000 people and the five-year projects and the Government Action plan to about 20,000 people.
These estimates have been made limited to the direct effects that the three types of measures in the health and welfare field will produce on employment. It can be expected that employment will also increase by other measures and by the secondary effect predicted based on the inter-industry relations analysis. In Table 2-4-8, the contribution of the health and welfare field to the increase of employment opportunities seems to be small compared with the contribution of other fields. This is because the data of other fields represent the scale of contribution not limited to fiscal 1999 (Table 2-4-8).
In and after fiscal 2000, it is expected that the social security-related employment will further increase. Triggered by the implementation of the long-term care insurance system, more private companies will participate in the social security field. Besides in accordance with the aging of society and decrease in the birthrate, the scales of childcare services, long-term care services, medical care services, and private services for the elderly ("silver business") will further expand.
Table 2-4-8. Fields Expected to Provide New Employment Opportunities and the Number of People Expected to be Newly Employed
(Support given to working people through social security)
Social security produces the following effects in addition to the effects on employment as explained above. Through social security systems, supports are given to independence of people and to the functions fulfilled by families. For example, by the improvement of long-term care services promoted under the long-term care insurance system, it becomes possible for women who dedicated themselves to the care of the family members to work outside. Furthermore, in accordance with the improvement of childcare services, the cases in which parents have to leave their jobs for the care of their children will decrease. As shown by these examples, social security also promotes employment in socioeconomic aspects.
3-3. Effects of Social Security on the Regional Economy
(Income redistribution between regions)
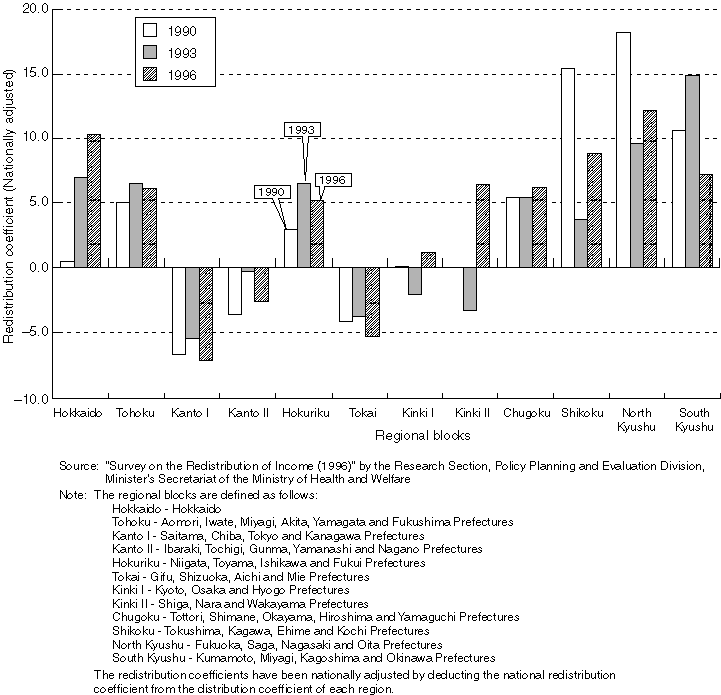
In addition to income redistribution among different income groups and different generations, social security contributes to the redistribution of income between regions. The number of people needing social security benefits, that of people paying social insurance premiums, and the amount of premiums paid differ among regions. People's lives in the regions with the high ratios of the elderly are supported by the income redistribution between regions.
According to the "Survey on the Distribution of Income" conducted in 1996, the redistribution coefficients were in minus in Kanto (Kanto I and Kanto II) and in Tokai but in plus in Kinki (Kinki I and Kinki II). (The coefficient is calculated as a ratio of the balance of the initial income and the income after redistribution to the initial income.) In the same Survey conducted in 1990 and 1993, the coefficients were in minus in Kanto, Tokai and in Kinki. The coefficients are in minus in the regions comprising the three metropolitan areas and in plus in other regions. It is estimated that the income is redistributed from the three metropolitan areas to other regions (Figure 2-4-9).
Figure 2-4-9. Income Redistribution by Regional Blocks (In 1990, 1993 and 1996)
(Public pensions in the regional economy)
As already mentioned, the elderly form a stable consumer group thanks to the receipt of public pensions. Also in the regional economy, they are expected to spend steadily. Especially in the regions with the high ratios of the elderly, the total amount of pensions paid and the consumption by the elderly are relatively high. As a result, although parts of goods and services to be consumed may be purchased from outside of the regions, more goods and services will be supplied within the regions and the regional economy will be activated.
What weight do public pensions occupy in the regional economy? According to the data provided by the Social Insurance Agency, the total amount of pensions provided in fiscal 1997 was about \212 billion in Shimane Prefecture that has the highest aging rate in Japan (23.1% as of 1997). The amount accounted for 10.6% of the prefectural income (\1,853.5 billion) and was about four points larger than the national average of 6.9%. If all of the pensions are utilized for consumption, the pensions will account for 16.3% of the Prefecture's living expenditure (\1,302.6 billion), which is higher than the national average of 10.6% (Table 2-4-10).
Table 2-4-10. Total Amount of Pensions and the Regional Economy
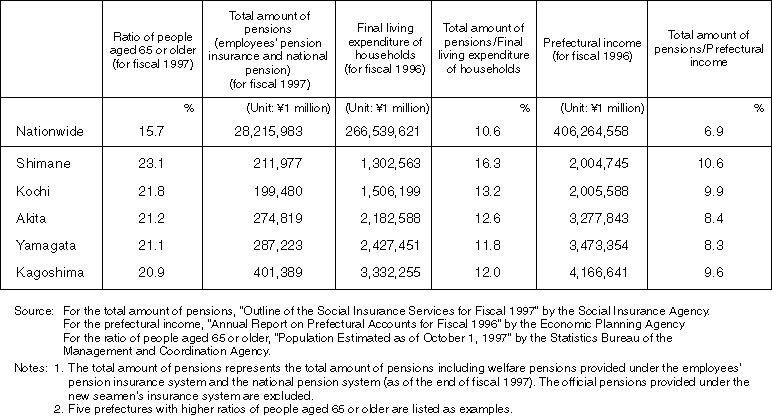
As explained above, income is transferred from regions with lower aging rates to regions with higher aging rates. (Refer to the Column on the Pensions and Rice Production.)
(Effect of social security on the regional economy)
Social security contributes to the regional economy by increasing the production or by creating new employment opportunities. For example, Ibaraki prefecture has made the following analysis based on the inter-industry relations tables. To attain the objectives set in the Ibaraki Prefecture's Plan for the Health and Welfare of the Elderly and to improve the welfare facilities and services for the elderly during the period from 1996 through 1999, it is required for the Prefecture to invest as much as \122.8 billion during the period. For the economic effect produced on the entire prefecture by the investment, it is estimated that production amounting to \186.2 billion will be induced and 12,270 people will be newly employed (Table 2-4-11).
Column
To understand the scale of public pensions paid in comparison with the local economy indexes, let us compare the total amount of public pensions paid (under employee's pension insurance and national pension programs) with the production of rice. In all of the prefectures ranked as the top ten in rice production in value, the amount of pensions paid exceed rice production by 1.5 times at the minimum and by 10.4 times at the maximum. This is a simple comparison, but it can be said that the payment of pensions plays an important role in the regional economy even in the regions called "major rice production areas."
|
Table 2-4-11. Comparison of the Investment Effect of the "Welfare Sector" and the "Construction Sector"
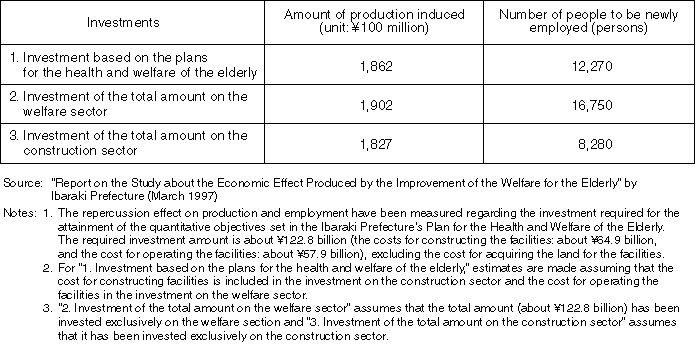
Table 2-4-12. Repercussion Effect on Economy Produced by the Investment of \100 Billion
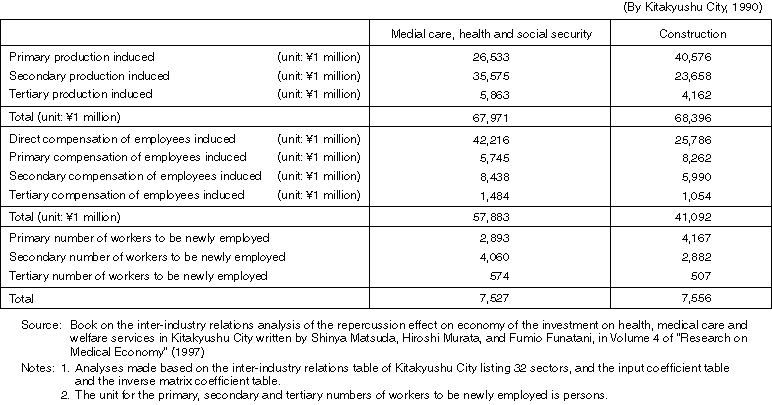
According to a study about the repercussion effect on economy of the investment on social security made in Kitakyushu City conducted based on the inter-industry relations table of the city, it is estimated as follows. If \100 billion is invested on the social security sector in Kitakyushu City, the production induced will amount to about \68 billion and about 7,500 persons will be newly employed (Table 2-4-12).
Regarding the analyses on the Prefecture and the City, it should be noted that such investments produce repercussion effects also outside the Prefecture or the City.
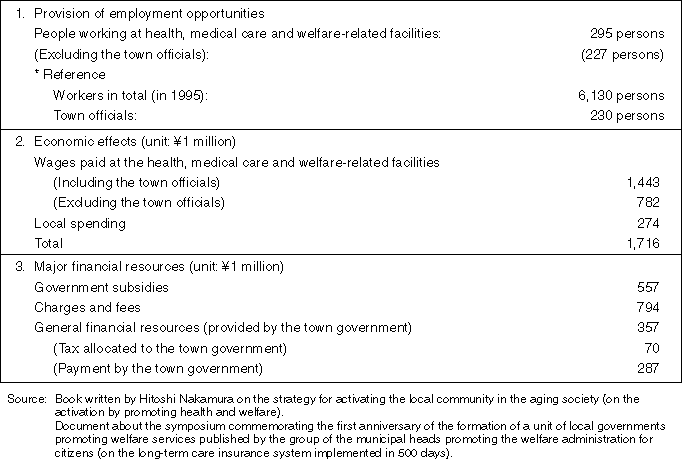
There are also cases in which local communities are activated through the promotion of welfare services. For example in Mogami Town (population: about 1,2000) in Yamagata Prefecture, networking of health, medical care and welfare services has been promoted. In the town, facilities for people with mental retardation, special homes for the elderly, health service facilities for the elderly and in-home care support centers were established and they are linked with the town hospital.
As a result, new jobs are provided to about 300 persons, which accounts for about 5% of the total number of workers in the town (6,130). The income has also increased by the increase of wages paid to the staff of the facilities and through the increase in the purchase of commodities from the merchants in the town. Besides the medical expenditure of the town has decreased because people are no longer hospitalized for social reasons.Especially the income increased by about \1.7 billion, which accounts for more than 60% of the rice production (\2.5 billion) in the town. Furthermore, the number of tourists increased in accordance with the increase of the number of study groups visiting the city. Besides some of the graduates of the local senior high schools, who lived outside the town have returned to the town (Table 2-4-13).
The aforementioned effects not only increase the local production and create new employment but also increase the tax revenues of the town, improve the town's financial situation, and increase the amount of social insurance premiums paid. It can also be expected that the economic effects produced by social security will strengthen the financial basis to support the social security systems.
Improvement of social security-related services in a region will contribute to the stabilization and further activation of the regional economy. Furthermore, improvement of medical care and welfare services not only produces economic effects but also enables citizens to live without worries. Accordingly, citizens will be more actively engaged in diversified activities, which will found the basis for creating new regional cultures.
Table 2-4-13. Economic Effects Produced by the Activation of the Local Community through the Promotion of Welfare Services in Mogami Town, Yamagata Prefecture
3-4. Economic Scales of Private, Non-profit Organizations
In Section 4 of Chapter 3, it will be pointed out that volunteers also support the social security systems. If the non-profit activities such as those conducted by volunteers and NPOs are measured in value, what economic scales will they have?
According to the economic analysis made on private non-profit organization by the Economic Planning Agency, the economic scale of the "private, non-profit organizations in a wide sense" amounts to about \15 trillion for fiscal 1995, accounting for about 3.1 of the GDP (about \489 trillion).
"Private, non-profit organizations in a wide sense" need to be non-profit (interests not distributed among the members), non-governmental (not controlled by the government in the operational and financial aspects), and voluntary (members are voluntarily engaged in activities). In addition to civil activity groups, medical corporations, social welfare foundations, schools, labor unions and religious corporations are included in private, non-profit organizations. If the economic scale is estimated in value targeting all of these organizations engaged in volunteer activities, etc., the amount will be about \700 billion.