AimWhat is the level of standard that Japan's social security system has achieved as a result of expansion and enhancement during the 60 years of health and welfare administration history, which is more than 50 years after the World War II? How shall we evaluate the system in international comparison?
After reviewing the international comparison of the expenditures on social security benefits in Chapter 2, we will now describe the health and medical services and medical insurance in Section 1, finance security for pension and public assistance in Section 2, and social welfare in Section 3 of this chapter. Finally in Section 4, we will review measures taken for education and securing of manpower for providing various services available in the social security system. |
In this section we will first indicate some examples of increasing average life expectancy and lowering death rate as a result of health and medical services, and then briefly summarize the current status and characteristics of the medical system and the medical insurance system.
1. Realization of the Longevity Society
The major achievements of the measures taken for health and medical services are as indicated below.
1 The world highest standard of average life expectancy
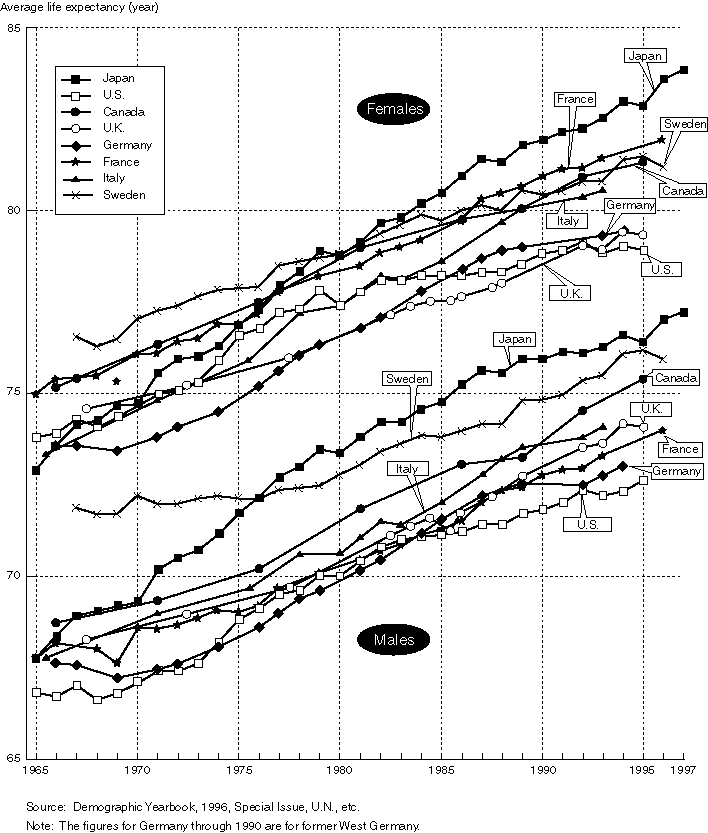
After the war the life expectancy at birth (life expectancy of newborn babies) extended remarkably as death rate decreased for all ages along with the improvement of public health, enhancement of the medical care system, advancement of medicine and medical technologies, improved standard of living, etc. (Figure 3-1-1).During the last 50 years, the life expectancy increased almost 27 years for men and about 30 years for women.In 1997 the life expectancy reached 77.l9 years for men and 83.82 years for women. Both are at the world highest level. In contemporary Japan, the word "koki" to express the rarity of reaching 70 years old(Note) no longer seems to fit our life style. However, according to "1998 Annual Report on the World's Population", the average life expectancy of the world in the 20th Century is projected 63.4 years for men and 67.7 years for women (both figures are projection) for the period of 1995 to 2000. Although it has been prolonged gradually, neither is reaching 70 years old.
(Note)
The word "koki" originates in one phrase, "Since the ancient times, it has been rare to live for 70 years", that is found in a poem titled "By the Winding River" written by Tu Fu, the master of Chinese poet in the Tang dynasty. Tu Fu did not live to the koki age, to his 70th birthday, and died at the age of 59.
The changes in death rates by age show that the decrease of the death rate for infants and small children is the major factor to the increase of the average life expectancy until around 1970, and after that the decrease of death rate for elderly people is contributing greatly to the improvement of average life expectancy. Particularly since in 1990s, approximately 90% of the improvement in average life expectancy are due to the lowered death rate of elderly people.
Among the first baby boomers, only 30% of men and 40% of women were expected to live through age 75 at their birth, but those percentages in 1996 have increased to 60% for men and 80% for women. While there were only 153 people passing 100 years old when"Social Welfare Service Law for the Elderly"was established in 1963, that numbers is now 66 times higher (1998), reaching 10,158 people to exceed 10,000 people. The longevity society expands the potential for people to challenge the second and the third new life plans.
Figure 3-1-1. International Comparison of Average Life Expectancy

2 High standard of health care
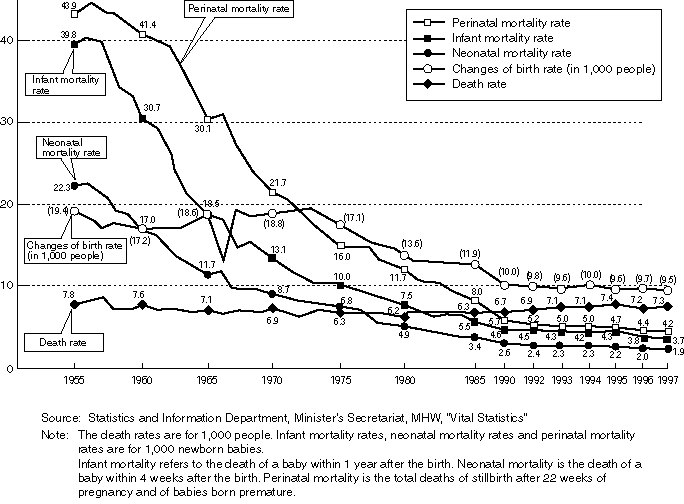
Infant mortality rate is a common index for measuring the standard of medical and health services, and the rate has drastically dropped after the war as a result of the Maternal and Child Health Measures and the improvement of medical technologies. The infant mortality rate in 1997 reached 3.7 babies per 1,000 births, which is a low rate even in the comparison with the U.S. and European nations. The maternal mortality rate is also low. In addition, the international comparison of death rates by age group shows lower rate in most age groups (Figure 3-1-2) (Figure 3-1-3).
Figure 3-1-2. Changes in Birth Rate, Death Rate, Infant Mortality Rate, Neonatal Mortality Rate, and Perinatal Mortality Rate
While disease patterns are shifting from infectious diseases to chronic diseases, the death rates by cause except for malignant neoplasm (cancer) indicate descending trends as a result of the development of medical systems and the promotion of health services (Figure 3-1-4). The decrease of death rates for tuberculosis and cerebrovascular is particularly remarkable. Even for cancer, which has been known as "malignant disease", the ratio of healing is increasing. According to the therapeutic results at the Central Hospital of the National Cancer Center, 5-year survival rate (the survival rate after 5 years from the treatment) in 1965, when the center was opened, was 30% for men and 50% for women, and in 1990s the rate improved to 55% for men and 65% for women. Because of early treatment and the advancement of therapeutic methods, cancer patients have been cured or their survival rate has improved (Figure 3-1-5).
3 Extending healthy life
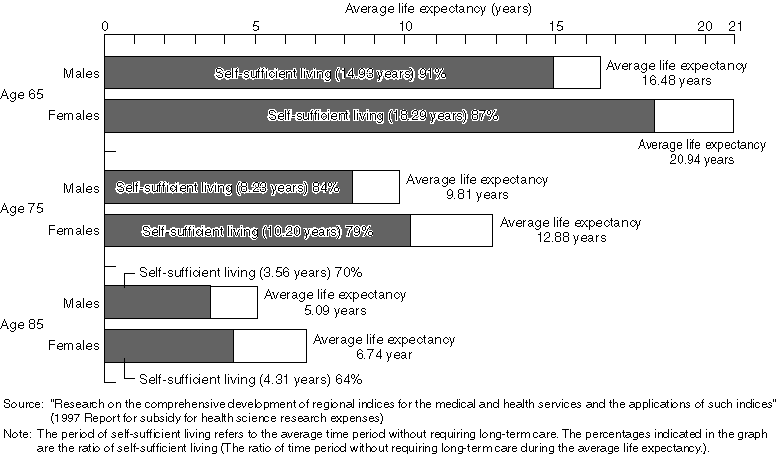
Reflecting the improvement of nutrition quality and of body posture, approximately 90% of people are feeling their health condition either "good" or "normal". Even for the issues of long-term care, which is considered as the greatest concerns in old age, the possibility of becoming the condition requiring long-term care in reality is about 13% of the population of age 65 and older, including the valetudinarians. The potential for needing such long-term care is not as high as the level of worries that many people feel. Some researches project that on the average people live independently without requiring long-term care for 90% of the lifetime between age 65 to the death (Figure 3-1-6). We shall further continue our efforts for health promotion to extend healthy life (the time period in which people can live without suffering from dementia or bedridden condition).
Figure 3-1-3. International Comparison of Death Rate, Infant Mortality Rate, Neonatal Mortality Rate,
Perinatal Mortality Rate, and Maternal Mortality Rate
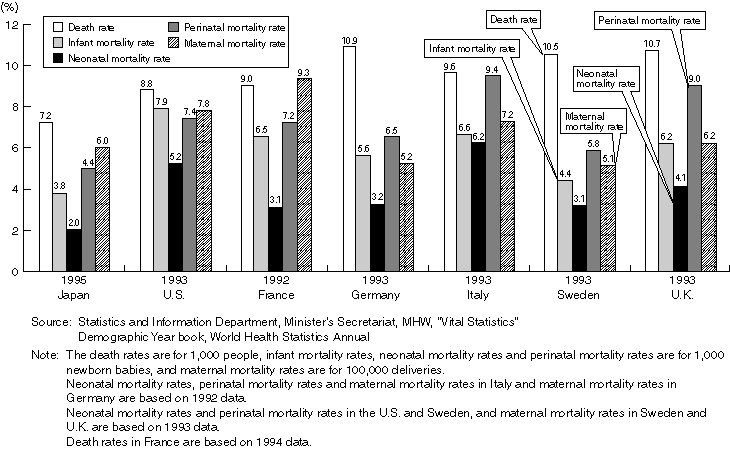
Figure 3-1-4. Age-adjusted Mortality Rate (for 100,000 people) by Sex and Major Cause of Death
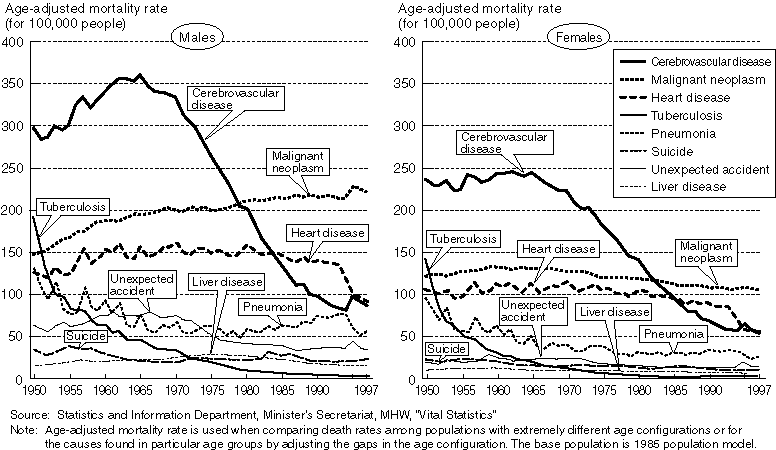
Figure 3-1-5. Improvement of Cancer Cure Ratio (Changes in 5-year survival rates for new inpatients)
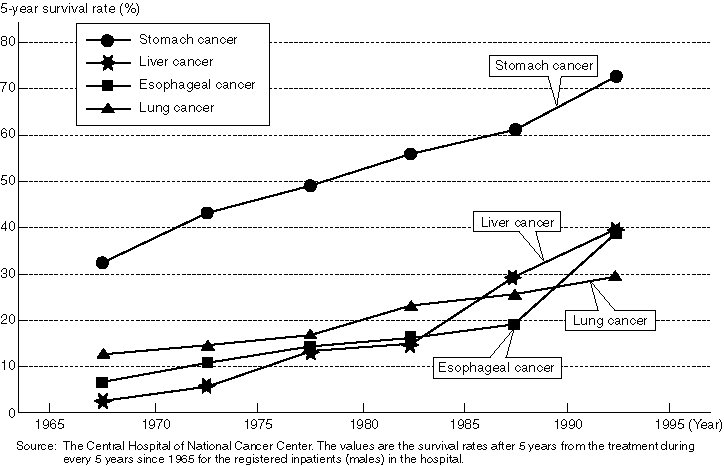
Figure 3-1-6. Average Time Period of Self-sufficient Living (1995)
2. Reliable Medical Services
2-1. Development of the Medical Care Delivery System
(Securing medical staffs and quantitative preparation of medical institutions)
In order to improve medical services, active promotion efforts began in around 1945 for training and securing medical staffs such as physicians, dentists, nurses, etc., and also for developing and preparing medical facilities and hospital beds.
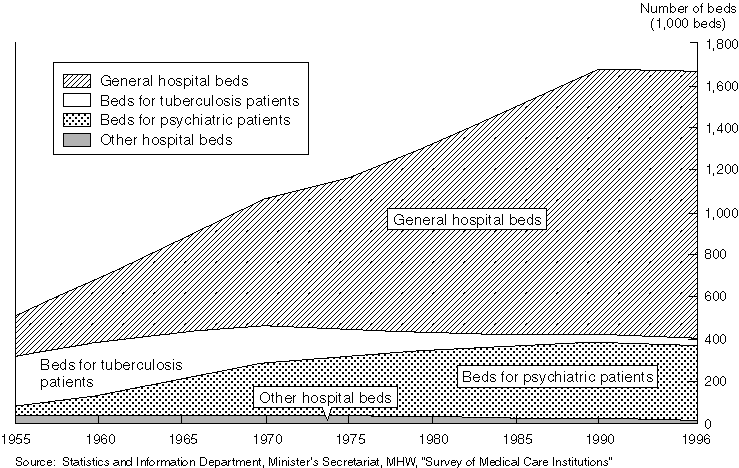
As a result, the number of physicians reached approximately 240,000 (191 physicians in every 100,000 people) and about 930,000 nurses (738 nurses per 100,000 people) in 1996, which is 2.3 times of increase for physicians and 5.0 times of increase for nurses compared to the figures in 1960 (Figure 3-1-7). The total number of medical facilities in 1996 reached approximately 157,000, consisting of about 9,500 hospitals, 88,000 clinics, and 59,000 dental clinics, with approximately 1.66 million beds in hospitals (Figure 3-1-8).
During 1960s, the Universal Medical Care Insurance System was established, and then the benefit of medical insurance was raised and some measures were taken to ease the burden of medical expenditures through the establishment of the high cost medical care benefit. As a result people's demands for medical care increased rapidly and the number of hospitals and beds also began to increase. Almost the same as the rapid development of economy, the time period between 1955 and 1975 was the time for quantitative expansion of medical institutions. Between 1955 and 1985, approximately 4,500 hospitals were added and about 980,000 hospital beds were added. The increase was almost 1.9 times for hospitals and 2.9 times for hospital beds in 30 years.
While the medical care delivery system was developed quantitatively, the Medical Service Law was amended and the Medical Care Plan was introduced in 1985 in response to the progress of aging, the change of disease patterns and the advancement of medicine and medical technologies, and also to resolve the issues of unbalanced distributions of medical resources, to establish the collaboration among hospitals, clinics and medical institutions, and to further improve medical care in local areas. The Medical Care Plan aimed at the promotion of systematic development of high quality health care in local communities by effectively utilizing medical resources and distributing the resources adequately while establishing the network and functional assignments among medical care related facilities. More specifically, multiple numbers of secondary medical regions were assigned for general hospital beds within each district of the prefecture, and "the required number of hospital beds" was set for each district to adequately distribute hospital beds. In recent years, the total number of hospital beds is coming to a stop and beginning to gradually decrease.
Figure 3-1-7. Changes in the Number of Medical Staffs
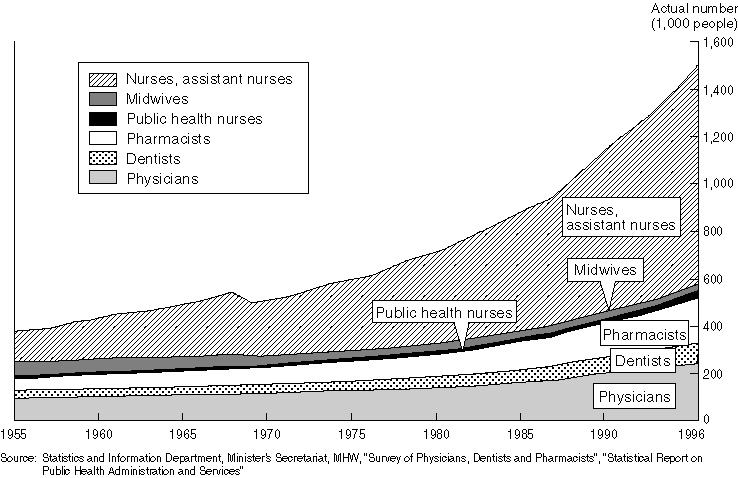
Figure 3-1-8. Number of Hospital Beds by Bed Type
2-2. Improvement of Medical Services
Medical services have been improved both qualitatively and quantitatively through the establishment of licensing systems for medical professionals, preparation and expansion of educational institutions such as universities, and the implementation of post graduation training to improve the quality of medical staffs as well as securing appropriate human resources.
Recently, the importance of respecting the decisions made by patients is gaining recognition, and while maintaining trust relationship between patients and medical professionals, medical practitioners provide sufficient medical information to the patient by practicing informed consent (Medical professionals provide medical treatment after having the patient properly understand about the procedure through explanations provided by medical staff). As an example, in 1997 the Medical Service Law was revised to stipulate that physicians and medical staffs make efforts to provide proper explanations to the patients so that they understand about the treatment. Also as part of the efforts for the insurers to improve their services to the insured, insurers began to disclose the statements of medical fees upon the request of the insured.
Improvement measures have also been in place to upgrade the hospital environment for inpatients by increasing private rooms, creating cafeterias, better distribution of nurses, etc. However, many other issues are yet to be resolved.
2-3. Benefits of the Medical Care System
In the view of users, Japan's medical care system offers the following 3 benefits:
2 A certain quality of medical care is available to all patients at a relatively low cost.
3 Patients are free to choose medical institutions.
Among these, 1 and 2 are achieved through the improvement of the medical insurance system along with the development of the medical care delivery system and the establishment of the Universal Medical Care Insurance. Regarding 3, patients are basically free to choose medical institutions, and the medical care system is structured to allow patients to access any medical institutions freely to receive services.
In addition to the easy access, medical institutions and hospital beds have been improved and most patients' medical care needs are now satisfied quantitatively. As an example, Figure 3-1-9 shows that the patient ratio to the total population under 65 years old has been either flat or decreasing since 1970. For the elderly people of age 65+, the number of outpatients is increasing until 1975 and inpatients until 1990, but both ratios are decreasing after those years. This is an indication that the demands for patient cares have been satisfied.
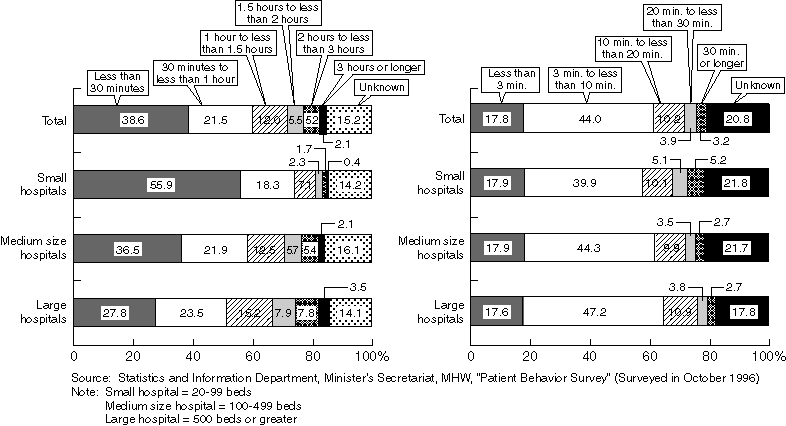
Sometimes the Japanese medical services are described as "Waiting for 3 hours to get 3 minutes examination".But, this expression is rather misleading, as the reality is quite different. Waiting time tends to be long in large hospitals, but with the increase of medical institutions and the introduction of appointment system, the most typical waiting time and examination time are now "waiting for less than 30 minutes" and "3 to 10 minutes of examination" (Figure 3-1-10).
Figure 3-1-9. Patient Ratio by Age Group (For 100,000 people)
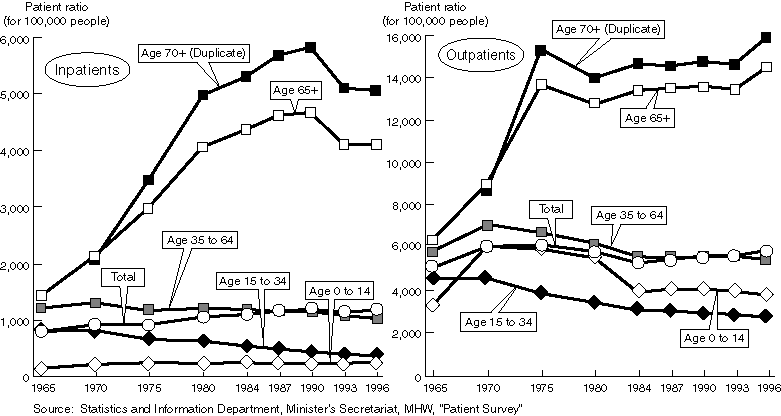
Figure 3-1-10. Waiting Time in Hospitals by Hospital Size (Before medical examination)
Duration of Medical Examination by Physician
2-4. International Comparison of Medical Care Services
Let's examine the quantitative comparison of medical care delivery systems in different countries using the OECD data(Note)!
In Japan the number of physicians per 1,000 people is relatively small, but the number of nurses is above the average (Figure 3-1-11). In contrary, the number of hospital beds is much greater. Compared to the U.S. the total number of hospital beds is about 1.6 times higher despite the population of Japan is about a half of the U.S., and the available hospital beds for 1,000 people is three times greater (Table 3-1-12). Because of the large number of hospital beds, the number of nurses per bed appears to be small compared to other countries.However, the allocation of nurses is gradually improving, and the number of nurses per 100 general hospital beds has increased 1.3 times during the last decade.
When comparing the patient behavior, the outpatient ratio is very high in Japan. As mentioned in the benefits of the Japanese medical care system, this indicates that patients are free to choose and receive treatment from any medical institutions (good access to medical institutions).
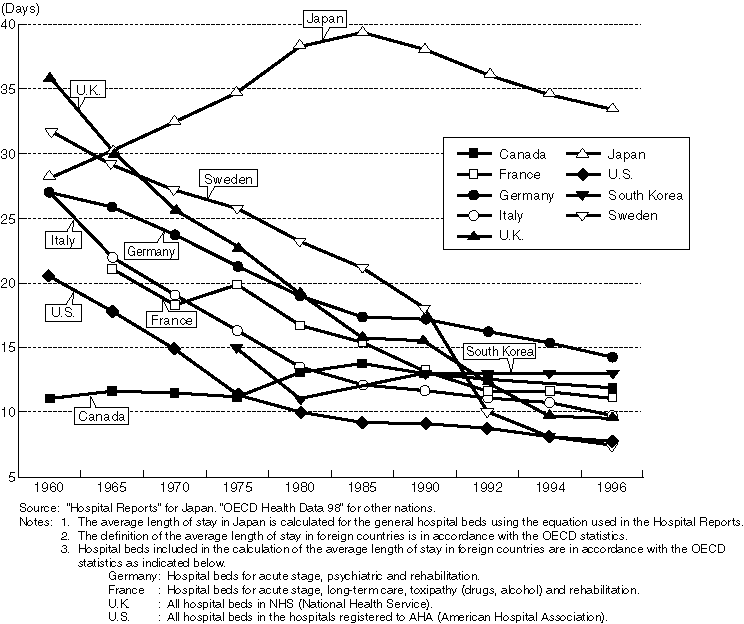
In contrary, once patients are admitted to a hospital as inpatient, the average length of stay is long in the international standard. This suggests that the function of hospitals, in-hospital medical care, and inpatient behaviors are clearly different from other countries. In some countries the average length of stay exceeded 30 days in the past, but it has reduced to less than 20 days in all countries (Figure 3-1-13).
In case of Japan some inpatients for long-term care stay in the hospital over a half year and the data with such hospital days is making the average length of stay long. However, in most hospitals the actual number of hospital days is around 20 to 25 days. In addition, the number of hospital days per person (the value of the total days of hospital stay divided by the total population) is small because of the small number of people with inpatient experience within one year.
A low ratio of inpatient expenditure in the total medical expenditures of Japan compared to other countries implies that a large part of revenue in Japan's medical institutions comes from outpatients.
(Note)
The countries included in the international comparison are the 7 nations that are the members of the Summit, Sweden and South Korea. OECD data contains some inconsistency because of different systems employed in each country. Therefore, it is not adequate to compare this data directly to determine the superiority and inferiority of the systems. It should be used to capture the general trends.
Figure 3-1-11. International Comparison of the Number of Physicians and Nurses
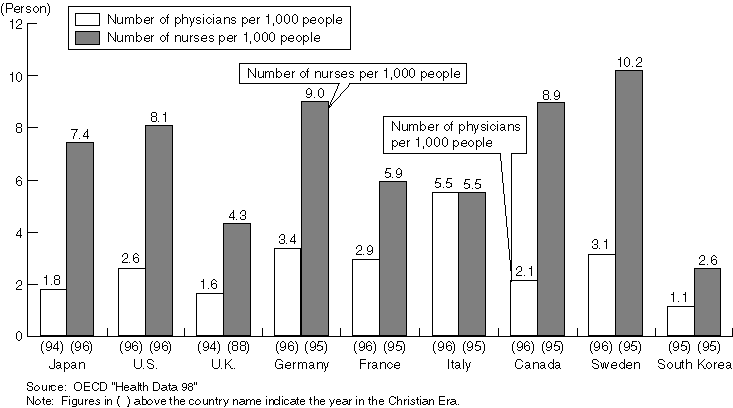
Table 3-1-12. International Comparison of the Number of Hospital Beds, Patient Behaviors, and the Utilization of Medical Facilities
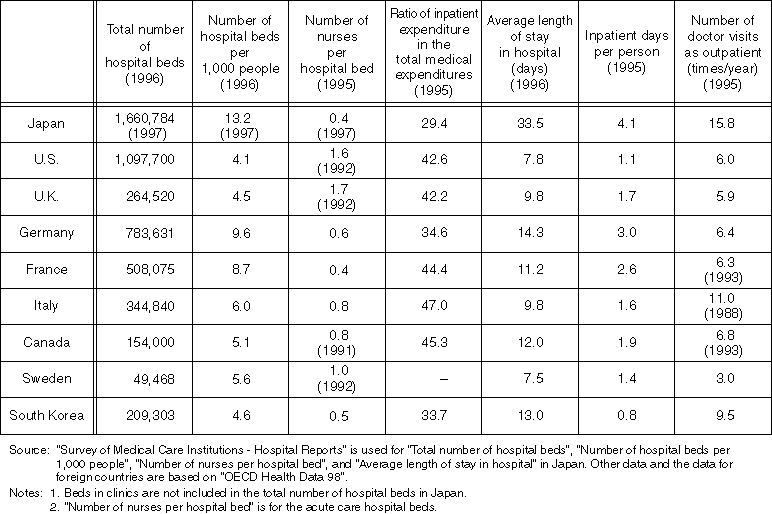
Figure 3-1-13. Changes in the Average Length of Stay
3. Further Development of the Medical Insurance System
In 1956 about 30 million people were not eligible for Japan's medical insurance system, but the National Health Insurance Law established in 1959 obliged all municipalities to implement the National Health Insurance and in 1961 the universal medical insurance was achieved (Figure 3-1-14). Subsequently, the benefit ratio was improved and medical care became accessible to everybody with small co-payment of 10 to 30% of medical expenditures through the establishment of the high-cost medical care benefit system that set the maximum value of co-payment and the small value of co-payment in the health service system for the elderly.
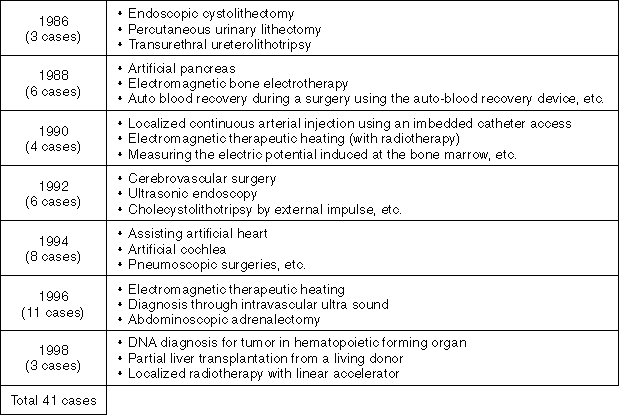
Regarding the medical services provided by the insurance, it covered a wide range of services at a sufficient standard, and along with the technological innovation in medical field new diagnosis and therapies are introduced to the medical insurance. As a result, many people became able to benefit from medical technologies (Table 3-1-15). Recently, medical practices to promote in-home care and home-visit nursing care are included in the insurance benefit, and the potential for in-home care is expanding.
When we compare the mechanisms for securing funds for medical expenditures with other countries, it is clear that Japan's medical insurance system is reaching a high standard in terms of insured ratio and benefits, although the sharing of medical expenditures, co-payment and the payment systems for medical expenditures are different in each country.
Figure 3-1-14. Changes of Population Covered by Medical Insurance
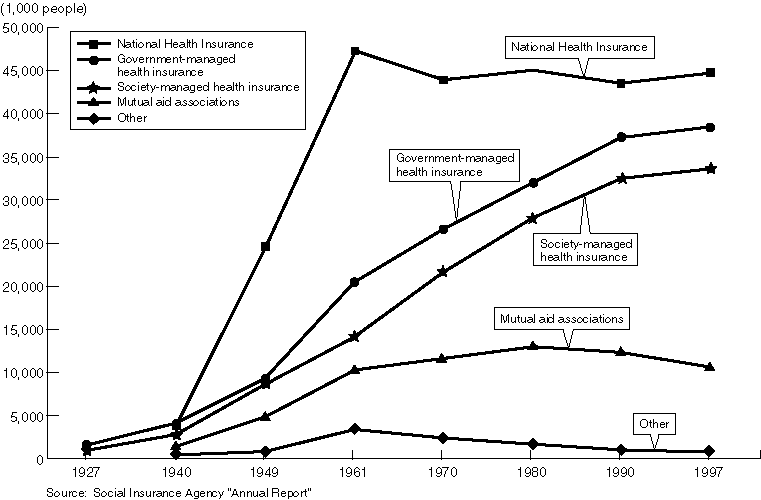
Table 3-1-15. Application of Health Insurance to Highly Advanced Medical Technology
4. Increase of Medical Expenditures
(Increasing medical expenditures)
While easy access to medical care is a benefit of Japan's medical care system, it is also causing the expansion of medical expenditures as Japan's national health expenditure has been increasing continuously. In fiscal 1961, when the Universal Medical Care Insurance became in place completely, the total medical expenditure was \513 billion, and the annual per capita value was \5,400, but in 1978 the total value exceeded \10 trillion and the figure has been growing every year by \1 trillion ever since. In fiscal 1996, the total reached \28.5 trillion and the annual per capita expense reached \226,000. The breakdown figures of per capital annual expenditure by age group indicate the increase with age, ranging from \208,000 for age 45 to 64, \559,000 for age 65 and older, and \658,000 for age 70 and older.
The scale of national health expenditure is growing every year, and it is projected to exceed \30 trillion for the first time in fiscal 1999. The current medical expenditure of Japan is 7.3% of GDP in 1997, which is a small ratio comparing to OECD nations. However, the growth rate of the medical expenditure is now much faster than the speed of economic growth. This unbalance is expected to worsen the finance condition of medical insurance. The main cause of this problem is aging. Considering the rapid increase of aging population in the future, the ratio of medical expenditure to GDP is expected to expand greatly. While high economic growth is no longer foreseeable in Japan, it is necessary to reform the system that keeps the stable balance with the economy (See the column).
Column
The national health expenditure in Japan has been increasing about \1.3 trillion every year. The burden of medical expenditure is borne by taxation, insurance or co-payment, but the medical care related expenditures alone of MHW budget funded by taxation are exceeding \7 trillion (Budget for fiscal 1999). This amount is greater than the total budget for education and science promotion including compulsory education expense, subsidies for higher education, operation cost for national universities, subsidies to private universities, and Japan's science promotion expenditures (\6.5 trillion). The size of the budget is enough to build 5 Tokyo Bay Aqua-lines, a recent public work, within 1 year.
However, there are some argument to claim that "the standard of Japan's medical expenditure is at a low level" because the ratio of medical expenditure to GDP is small compared to other countries indicated in some data such as OECD's "Health Data". Then, what is the level of Japan's medical expenditure in comparison with the world standard?
The latest statistics (1997) of OECD's "Health Data" are indicated in the table provided on the next page. The ratio of Japan's medical expenditure to GDP is ranked the 18th among 29 OECD member nations, which is lower than the middle level. However, should we consider that the standard of Japan's medical expenditures is at a low level because of this data? The ratio to GDP is only representing the relative size of the spending to the nation's economic scale. According to "Per capita medical expenditure", which indicates the medical expense for each citizen, Japan is ranked the 6th among 29 nations. Considering the extremely high medical expenditure in the U.S. and Switzerland, Japan's standard is still at a high level among OECD nations even it is at the 6th. With the rapid aging in the future, the ratio of medical expenditure to GDP is likely to become large.
Furthermore, while Japan's total medical expenditure is about $310,000, 30% of that in the U.S., it is ranked the 2nd among OECD nations, following the U.S., and the amount is 1.5 times greater than Germany's that is ranked the 3rd, and 2.2 times of France's and 3.6 times of the U.K.'s (The definition of medical expenditure in OECD documents covers a wider range than the concept used for "National Medical Expenditures" in the statistical data in Japan. For example, OECD data includes public health expense such as non-prescription drugs and vaccinations, management and operation expense, R&D expense, etc., and these are not included in Japan's data.).
For the comparison of medical expenditure standards, there are many other methods than these macroscopic views such as the comparison of medical cost for the same disease, comparison of cost and effectiveness of the medical expenditure, relative comparison with the standard of living in individual nations, etc. In many cases the basic range of medical expenditures is actually different by country. Obviously, more detailed studies are required to compare different nations more accurately. International Comparison of Medical Expenditures (1997)
|
(Expansion of the medical care expenditure for the elderly)
With the increase of aging population, the medical care expenditure for the elderly has been growing faster than the growth rate of national health expenditure, and the medical care expenditure for the elderly in 1998 was projected to reach \10.6 trillion, 36.1% of the national health expenditure. It is expected to further grow to reach 50% of the national health expenditure in around year 2025.
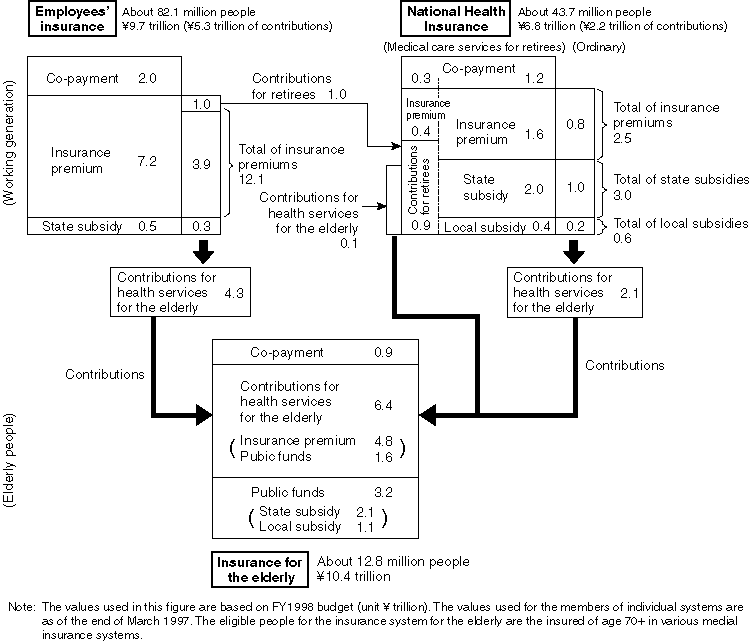
The medical care expenditure for the elderly is paid by the contributions for health services for the elderly, which is mostly borne by the insured of the working generation and business owners, and by the contributions shared by the national and local governmental organizations. The amount of contributions is increasing every year and becoming a heavy financial pressure to medical care insurers. Approximately 30% of the expenditures of medical care insurers are allocated as the contributions for health services for the elderly to support the medical care for the elderly. From the view of salaried workers of the working generation, approximately 30% of the medical insurance premium they pay (or 40% including contributions for retirees) are spent for the medical care for the elderly, and that ratio in the premium is rising (Figure 3-1-16).
Figure 3-1-16. Structure of Financial Resources for Medical Expenditures (Overview)
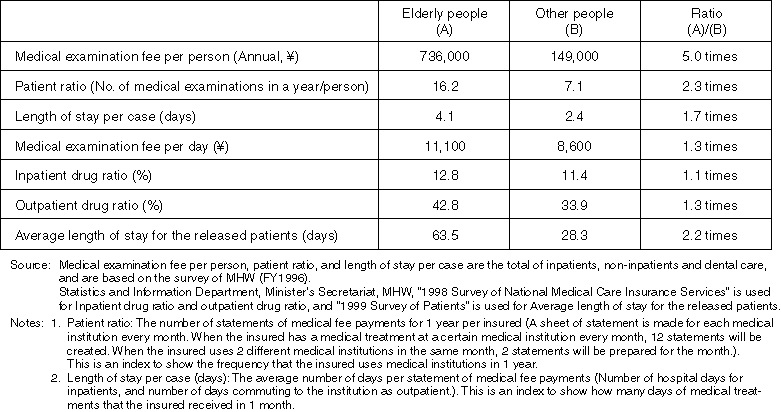
The reason for the fast increase of the medical care expenditure for the elderly with the advancement of aging is the higher medical examination fee per person for the elderly than younger people. This is due to higher patient ratio, prescription ratio, and the average length of stay in hospitals for the elderly (Table 3-1-17).
Although the contents of international data are not always consistent and not adequate for strict comparison, the medical expenditure for elderly is five times higher than that for younger generations in Japan while the gap is about four times in the U.S. and the U.K., and three times in Germany and France. Inpatients for long-term care and a high ratio of prescription drugs are recognized as problems of Japan's medical expenditures, and these characteristics directly appear in the medical care services for the elderly.
Table 3-1-17. Comparison between the Elderly and Other People
