1-1. Changes in the Scale of Social Security Benefits Viewed in Relation to National Economy
(Changes of social security benefits)
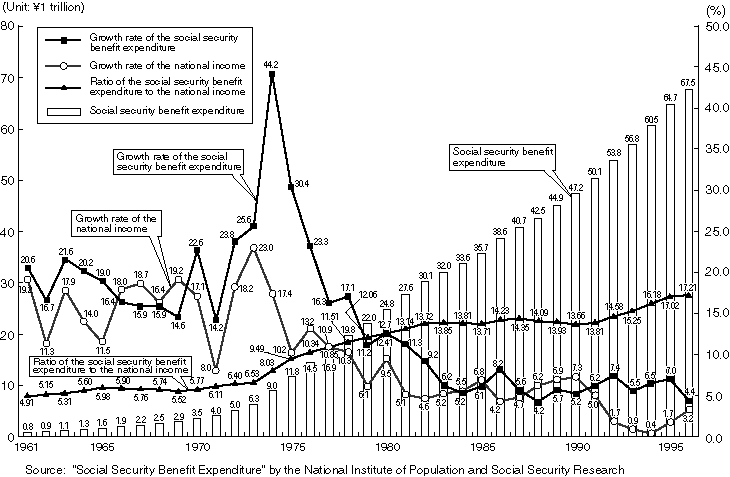
As outlined in Section 1 of Chapter 1, Japan's social security benefit expenditure has been rapidly increasing, with the improvement of the social security systems brought about during the period from the postwar confusion through the high economic growth. In the high economic growth period from 1955 to around 1973, the social security benefit expenditure increased by nearly 20% every year, from \389.3 billion in 1955 to \790 billion in 1961 when universal medical care insurance programs were introduced and to \4,984.5 billion in 1972. Thus in 17 years, the amount increased by about 13 times. In relation to national economy, the economy showed a high growth rate in the period, and the ratio of the social security benefit expenditure to the national income shifted within the range from around 5% to 6.5%.
Also after 1973, the social security benefit expenditure continued steady increase because of the improvement of benefits promoted in the "first year of welfare" and due to the remarkable raise in the payment level achieved by the introduction of the price indexing system for pensions following the first oil crisis . On the contrary, the economy became stagnant and through around 1980, the growth rate of the social security benefit expenditure exceeded the growth rate of the national income. As a result, the ratio of the social security benefit expenditure to the national income doubled in about ten years from 6.53% in 1973 to 13.72% in 1982.
From around 1980 to around 1991, the growth rate of the social security benefit expenditure was almost equal to the growth rate of the national income. For the backgrounds, the elderly began to share reasonable burdens under the health service system for the elderly established in 1983. Besides the medical expenditures began to shift in harmony with changes in the economic growth by the introduction of the payment of 10% of the medical fees by the insured under the health insurance system in 1984.
The social security benefits are composed of benefits that are indispensable for ensuring healthy lives to people and of benefits of which recipients are predicted to increase in accordance with the aging of society. The benefits therefore tend to increase regardless of the economic situations. Also after 1992, the social security benefit expenditure continued to increase steadily while the national income did not increase very much because of the collapse of the so-called "bubble economy." As a result, the ratio of the social security benefit expenditure to the national income kept rising and recorded the highest percentage (17.21%) in 1996 (Figure 2-3-1).
(Details concerning the growth rate of the social security benefit expenditure)
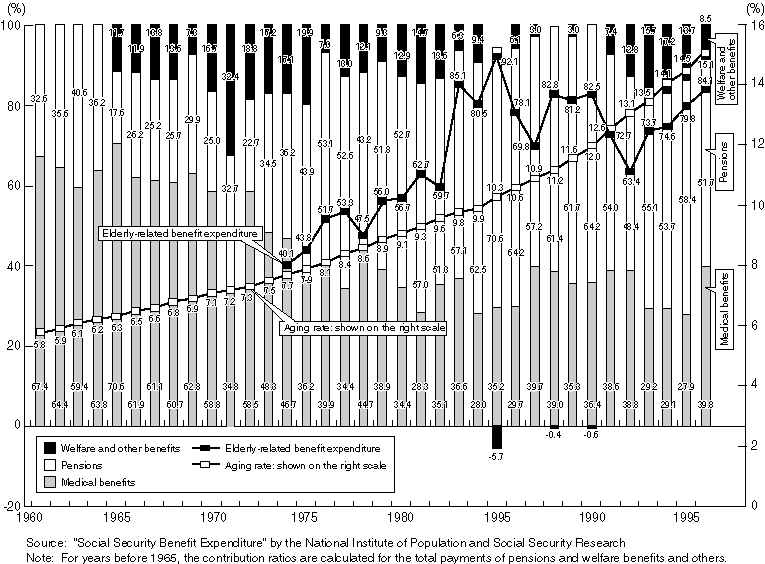
For the contribution ratios of pensions, medical benefits and welfare benefits to the growth rate of the social security benefit expenditure, the medical benefits had been showing the ratio of about 60% till around 1970. However, since the latter half of the 1970s, the contribution ratio of pensions has been increasing. In the recent years, pensions have been showing the highest ratio (about 50 to 60%), followed by medical benefits (about 30 to 40%) and by welfare benefits and others (about 10%).
In accordance with the aging of society, the contribution ratio of the elderly-related benefit expenditure (total amount of pensions and benefits to be paid to the elderly for medical services, welfare services, etc.) has been increasing. In the recent years, the elderly-related benefits have been showing the contribution ratio of about 80% (Figure 2-3-2).
1-2. Social Security Benefits Composed Mainly of Pensions and Medical Benefits
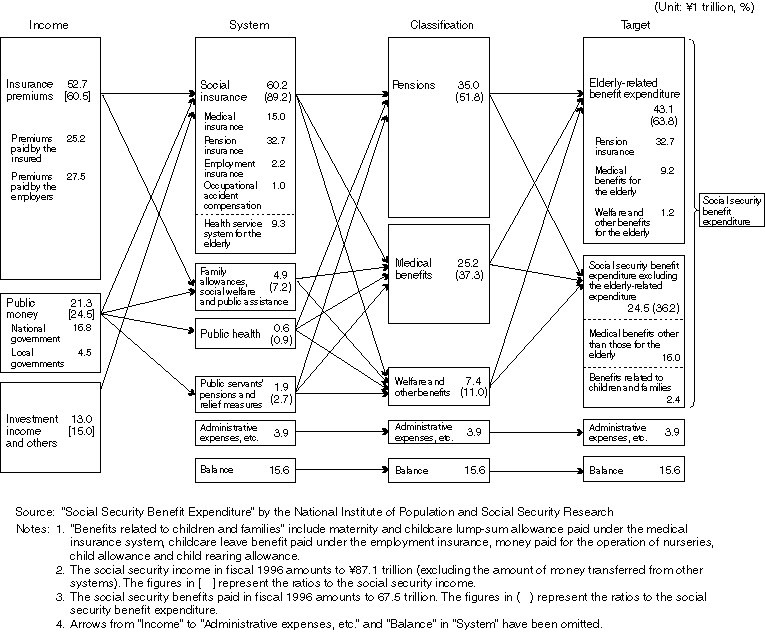
For the breakdown of the social security benefit expenditure, 90% of the benefits are provided under the social insurance system. For the rates each of "pensions," "medical benefits" and "welfare and other benefits" account for in the social security benefit expenditure, pensions account for the largest percentage (51.8%), followed by medical benefits (37.3%) and by welfare and other benefits (11.0%) for fiscal 1996 (Figure 2-3-3).
Figure 2-3-1. Changes in the Social Security Benefit Expenditure and in the National Income
Figure 2-3-2. Contribution Ratios of Pensions, Medical Benefits, and Welfare and Other Benefits, and
Elderly-related Benefit Expenditure to the Growth Rate of the Social Security Benefit Expenditure
Till 1970, medical benefits had been accounting for the largest percentages in the social security benefit expenditure. In fiscal 1981, however, the rate of pensions exceeded that of medical benefits and since then pensions have been accounting for more than 50% of the total expenditure. As described later, compared with social security benefit expenditures of the United States and of European countries, pensions and medical benefits have more weight than social welfare benefits, family allowances or unemployment benefits in Japan's social security benefit expenditure.
Figure 2-3-3. Social Security Benefit Expenditure Viewed in Relation to the Income, System, Classification and
Target (Fiscal 1996)
1-3. Increasing Benefits for the Elderly
For the target of social security benefits, the elderly-related benefit expenditure accounts for a remarkable percentage in the total amount of the social security benefit expenditure. Of the social security benefits paid in fiscal 1996, 64% or \43 trillion was the elderly-related benefits. They were paid as pensions (\33 trillion), medical benefits for the elderly (\9 trillion) and welfare and other benefits for the elderly (\1 trillion). The amount of benefits received by people aged 65 or older is estimated to be about \2.3 million per person on the average, by dividing the elderly-related benefit expenditure by the number of people aged 65 or older, although the recipients of the elderly-related benefits are not always aged 65 or older. The per-capita amount far exceeds the national average (about \540,000 per person). The elderly-related benefit expenditure accounted for 25% of the total in fiscal 1973 and the rate has been increasing every year. Most of the benefits paid under the pension insurance system or the health service system for the elderly are financed through social insurance premiums paid by the working generations.
The social security benefit expenditure excluding the elderly-related benefit expenditure amounts to \24 trillion, accounting for 36% of the total. For the breakdown, medical benefits excluding those for the elderly amounts to about \16 trillion, and unemployment benefits and benefits related to children and families amount to about \2 trillion respectively. According to the fiscal 1996 data on the national health expenditure announced by the Statistics and Information Department of the Minister's Secretariat of the Ministry of Health and Welfare, the health expenditure for general medical services and the expenditure for dental care totals about 2 trillion for people aged 0 to 14 and about \15 trillion for people aged 15 to 69, including the amount paid by the patients themselves.
1-4. International Comparison of the Social Security Benefit Expenditure
(Comparison of the social security benefit expenditure scale)
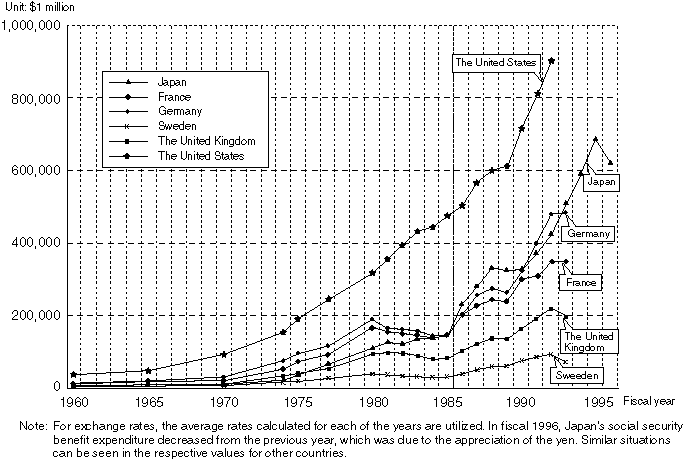
Japan's aging rate was low compared with other countries in the past. The rate, however, increased to 16.2% in 1998, reaching almost the same level as the United States (12.8% in 1996), France (15.4% in 1997), Germany (15.8% in 1997), the United Kingdom (15.7% in 1997) and Sweden (17.4% in 1997). Under such circumstances, Japan's social security benefit expenditure scale has become the second largest following the United States (Figure 2-3-4).
Figure 2-3-4. International Comparison of the Social Security Benefit Expenditure Scale (in dollars)
In Japan, because the economic scale is also large, the ratios of the social security benefit expenditure to the gross domestic product (GDP) and to the national income (NI) are on the low level compared with the United States and the European countries. By classification, there are relatively large differences in "pensions" and "welfare and other benefits" between Japan and other countries. Because social security systems differ among countries, it is difficult to compare such differences. However, there can be several factors contributing to such differences (Figure 2-3-5).
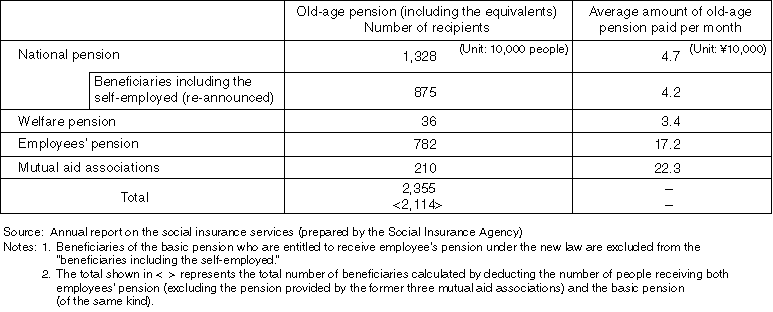
For pensions, Japan's pension system is relatively young and not so matured as those of the United States and the European countries. For employees' pension, the amount can stand comparison with the wages of the working generations. However, influenced by Japan's past industrial structure and employment structure, many of the pensioners receive only national pension, which is provided in relatively small amount (Table 2-3-6).
For welfare and other benefits, the amount of unemployment benefit is small in Japan, which is because the unemployment rate is relatively low in the country. The differences in the amount of welfare and other benefits may also reflect the differences in social security systems among the countries, including the differences in the relationship between family allowances and taxation and the housing policies. For example in the United Kingdom, housing benefits are one of the representative benefits provided under the social assistance system. In Japan, however, housing benefits are provided on a small scale under the public assistance system.
Figure 2-3-5. International Comparison of the Social Security Benefit Expenditure
(of the ratios to GDP and NI) (For fiscal 1993)
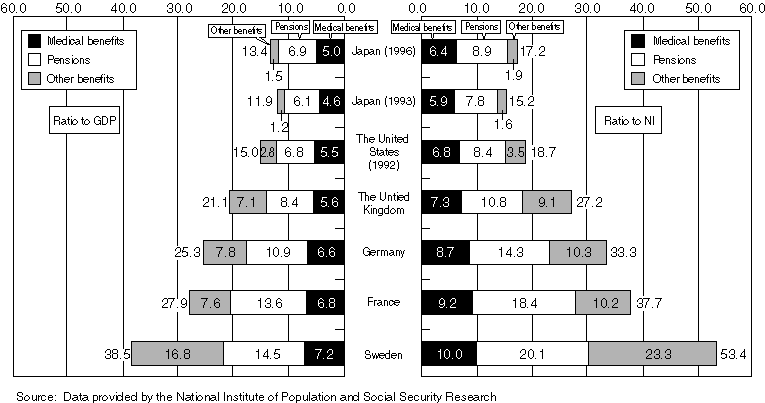
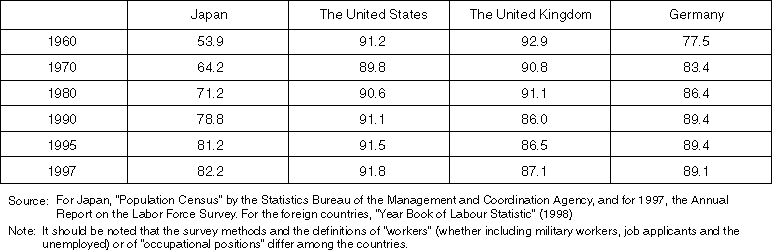
Table 2-3-6. Payment of Public Pensions in Japan and Changes in the Ratio of Employees to the
Total Number of Workers in Each Country
(1) Payment of Public Pensions in Japan (as of the end of March 1998)
(2) Changes in the Ratio of Employees to the Total Number of Workers in Each Country (Unit: %)
(International comparison of the per-capita social security benefit expenditure)
Japan's per-capita social security benefit expenditure is \537,000 for fiscal 1996 and \455,000 for fiscal 1993. This is above the levels of the United States (\442,000 for fiscal 1992) and the United Kingdom (\378,000 for fiscal 1993) but slightly below the levels of Germany (\667,000 for fiscal 1993) and of France (\674,000 for fiscal 1993). Sweden's per-capita social security benefit expenditure is \911,000 for fiscal 1993.
2. Social Security Benefits and Burdens in National Economy
2-1. Relationship between Social Security Benefits and Burdens in National Economy
For the flow of money regarding social security benefits and burdens in the national economy of Japan, the amount that is larger than the amount of income tax (\19 trillion) or of corporate tax (\13 trillion) is paid as social security burdens (social insurance premiums) by the insured (\26 trillion) as well as by the employers (\27 trillion). These premiums provide the financial resources for the payment of pension, medical and other benefits to citizens on the monetary scale that parallels with that of the general administrative services provided by the national and local governments. Of the amount of social insurance premiums paid by the insured, about 80% is paid by employees (salaried workers) for fiscal 1997 (Figure 2-3-7).
For private insurance, private life insurance companies and the postal life insurance bureau received \45 trillion as premiums in total in 1997. Of the amount, \20 trillion was the premiums for personal life insurance and pension insurance collected by private life insurance companies, which accounts for about 75% of the amount of social insurance premiums paid by the insured themselves.
2-2. Financial Resources for the Social Security Benefit Expenditure
For the financial resources to pay the social security benefit expenditure, the insurance premiums paid by the insured and the employers account for about 60% and the public expenditure (financed through tax revenues by the national and local governments) about 25% of the total. Thus the premiums and the public expenditure together account for more than 80% of the financial resources. The public expenditure accounted for about one third of the total in the 1970s but has gradually decreased to the present share of about 25%. In accordance with the rapid development of the social insurance field such as medical insurance and pension insurance among the social security systems, the social insurance premiums have increased and presently account for about 60% of the financial resources, while the public expenditure has been decreasing on a long-term basis. However, for the national health insurance and the health service system for the elderly, the public expenditure accounts for a relatively high percentage in the financial resources based on the idea that each of the systems should be stabilized on the responsibility of the government (Figure 2-3-8).
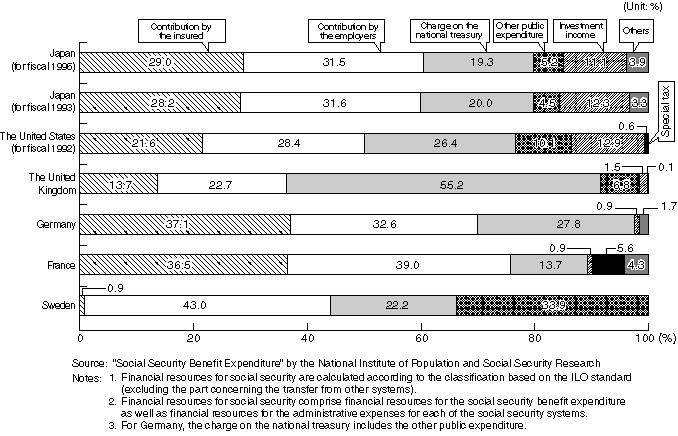
For international comparison, the percentage that social insurance premiums account for in the financial resources for social security in Japan is almost on the same level as in the United States. The percentages shown by these two countries are lower than those in Germany and France where social security systems focus on social insurance and are higher than those in the United Kingdom and Sweden where social security systems are provided mainly based on the public expenditure. For the percentage that the public expenditure accounts for in the financial resources in Japan, it is on the higher level than in France and on the same level as in the United States and German. It is on the lower level than in the United Kingdom and Sweden where the public expenditure accounts for 50% or more in the financial resources for social security. In the United Kingdom, the public expenditure accounts for a high percentage because medical services are provided under the National Health Service. In Sweden, the local governments share about 60% of the public expenditure (Figure 2-3-9).
Figure 2-3-7. Social Security Benefits and Burdens in National Economy (For fiscal 1997)
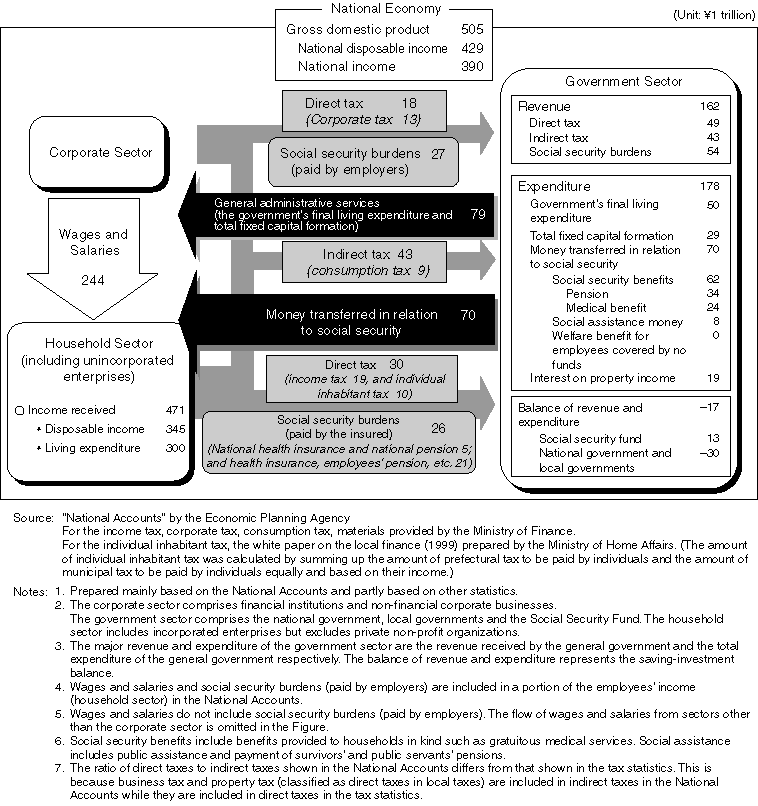
Figure 2-3-8. Changes in the Financial Resources for Social Security
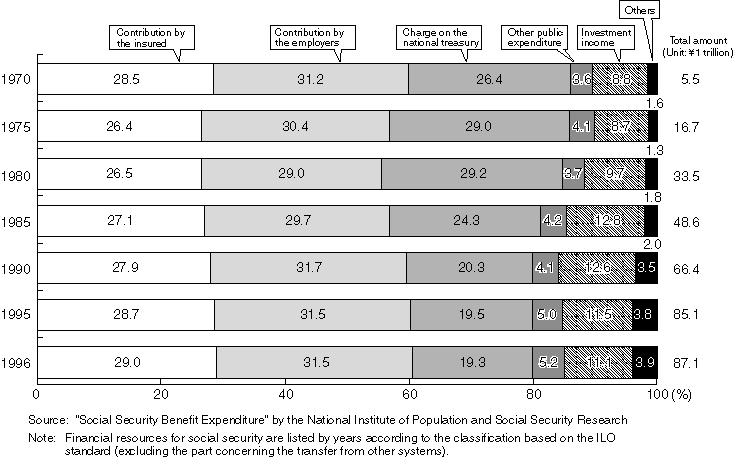
Figure 2-3-9. International Comparison of the Component Ratios of the Financial Resources for
Social Security (For fiscal 1993)
3. Changes in the Social Security Expenditure in the National and Local Finance
3-1. Increase of the Social Security-related Expenditure in the National Finance
The social security-related expenditure in the general accounting budget has also been continuously increasing. In the government's budget for fiscal 1999, the social security-related expenditure amounts to \1,695 billion, accounting for about 20% of the total amount of the general account expenditure budget. For the general expenditure excluding the grants from the national government to local governments and taxes allocated to local governments, government bond expenses, etc., the social security-related expenditure accounts for about one third of the amount, ranked as the largest expenditure item in the general expenditure. Of the social security-related expenditure, the social insurance-related budget such as subsidiaries for the national health insurance alone amounts to about as much as \9.5 trillion in the fiscal 1999 budget. This far exceeds the scales of the public works-related expenditure (about \9.4 trillion), the expenditure for promoting education and science (\6.5 trillion), and of the defense-related expenditure (\4.9 trillion).
For the changes in the breakdown of the social security-related expenditure, please refer to Figure 2-3-10. As described in Section 1 of Chapter 1, the focus of Japan's social security systems was "relief for the needy" in the 1950s and in the period, and the expenditure for public assistance accounted for a high percentage in the social security-related expenditure. For example, one third of the total expenditure was occupied by the expenditure for public assistance in 1955. However, from the latter half of the 1950s or from the 1960s, medical benefits provided under the medical insurance system, pensions such as old-age pension provided under the pension system, and the expenditure for social welfare for children or the elderly greatly increased. Their increasing rates exceeded the increasing rate of the expenditure for public assistance or the expenditure for public health service. As a result, the percentages that the expenditures for public assistance, for public health service and for measures against unemployment account for in the total have been decreasing, while those of the expenditures for social insurance and for social welfare have been increasing.
Presently, the expenditure for social insurance accounts for about 60%, and the expenditure for social welfare accounts for 30% of the total, while the expenditure for public assistance accounts for less than 10% (about 8%) of the total (Figure 2-3-10).
3-2. Increase of the Social Security Expenditure in the Local Finance
Local governments are playing important roles in the social security administration. They are engaged in diversified social security services. For example, they promote social welfare for children, for people with disabilities or for the elderly, provide public assistance, promote public health, dispose night soil and waste, and implement the national health insurance services and health services for the elderly. The costs for these services are covered by the national government (a certain amount of money is provided to the local governments from the national government's social security-related expenditure as subsidies, etc.), by the local governments and by the users themselves.
In the local finance, the costs for social welfare and public assistance are classified into the public welfare expenditure, and the costs for public health and cleaning into the sanitation expenditure. The public welfare expenditure and the sanitation expenditure account for 13.0% and 6.9% of the total expenditure of the entire local finance respectively. The public welfare expenditure is the third largest expenditure item in the local finance, following the civil engineering expenditure (accounting for 21.8% of the total) and the educational expenditure (accounting for 19.2% of the total). Especially on the municipal level, the public welfare expenditure is the second largest expenditure item following the civil engineering expenditure. As shown in Figure 2-3-11, the public welfare expenditure of all the local governments has been increasing especially for welfare for the elderly and children. Comparing fiscal 1997 with fiscal 1980, the public welfare expenditure has increased by 2.5 times. In detail, the public welfare expenditure was \12.7 trillion and the sanitation expenditure was \6.7 trillion in fiscal 1997. For the national health insurance service and the health and medical care services for the elderly that are implemented by municipalities under special accounts, the expenditure amounts to \7.7 trillion for the former service and to \9.8 trillion for the latter services (Figure 2-3-11).
Figure 2-3-10. Changes in the Social Security-related Expenditure
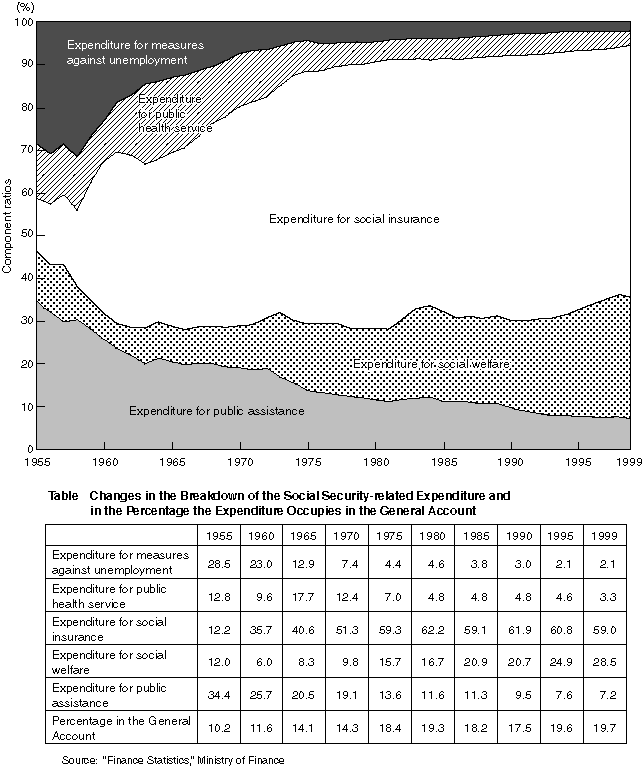
Figure 2-3-11. Changes in the Components of the Annual Public Welfare Expenditure
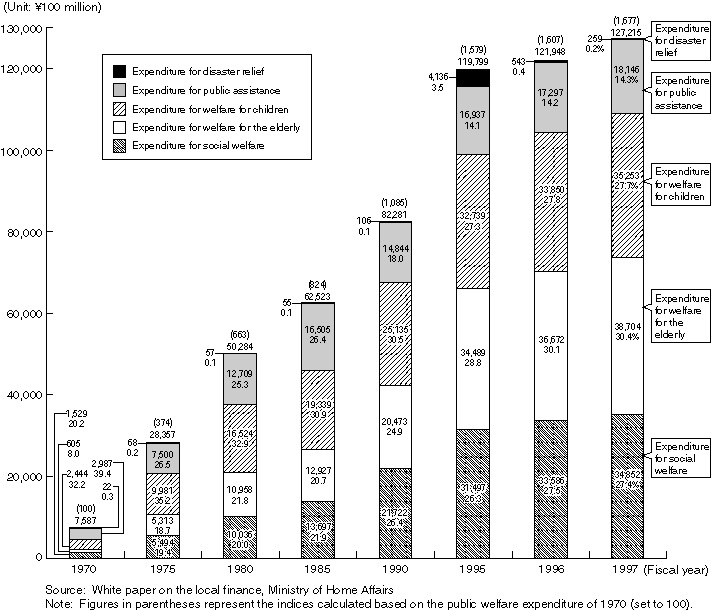
Table 2-3-12. Changes in the National Burden Rate, Disposable Income, and the Consumer Price Index
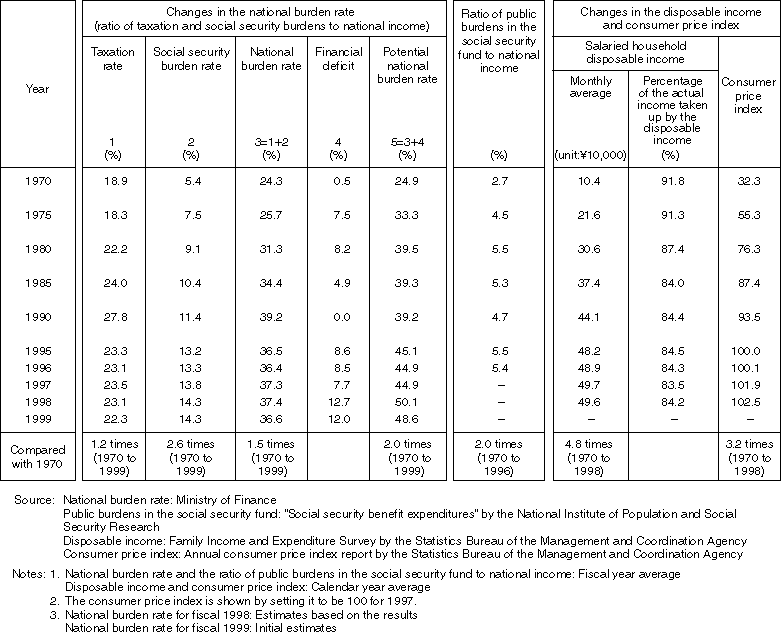
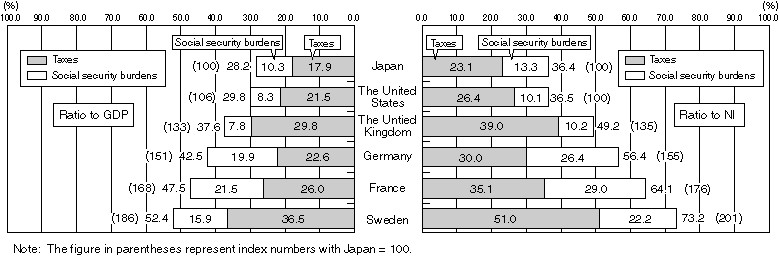
Figure 2-3-13. International Comparison of Tax and Social Security Burdens (For fiscal 1996)
4. Argument about the National Burden Rate
4-1. Changes in the National Burden Rate
In accordance with the increase of the social security benefit expenditure, social insurance premiums and the public expenditure for social security have been increasing. Since 1990, social insurance premiums and the public expenditure have been increasing annually by about \2 trillion and by \1 trillion on average respectively.
Generally, social security burdens are often discussed based on the national burden rate (ratio of taxation and social security burdens to the national income). In Japan, the rate has increased by 1.5 times during 29 years, from 24.3% in fiscal 1970 to 36.6% in fiscal 1999. For the breakdown of the rate, the social security burden rate has increased by 2.6 times from 5.4% to 14.3% (8.9 points up). The taxation rate has also increased by 1.2 times from 18.9% to 22.3% (3.4 points up), although the rate sometimes declined during the period. Thus a great portion of the increase in the national burden rate has been due to the increase of social security burdens (Table 2-3-12).
For the household economy, the average monthly disposable income per salaried household has increased by 4.8 times from \104,000 in 1970 to \496,000 in 1998, exceeding the increasing rate of the consumer price index (increase by 3.2 times). The actual value of the disposable income adjusted by price indexing has increased by 1.5 times. The national burden rate has increased in accordance with the expansion of the social security systems. At the same time, the disposable income of each household has been steadily increasing.
4-2. Argument about the National Burden Rate
There is a concern that the increase of social security benefits and the subsequent increase of the social security-related expenditure might lead to the decrease of other governmental expenditures, to financial rigidity, to stagnant national economy or to excessive burdens on future working generations. It is therefore pointed out in the 1982 report of the Ad Hoc Commission for Administrative Reform that the national burden rate should not exceed 50% even at the peak of aging. The second and third Ad Hoc Council for Administrative Reform also expressed the same opinion.
In the "Directions of Structural Reform of the Social Security System (Interim Report)" prepared by the Conference of the Chairmen for Councils Related to the Social Security System in 1996, the following idea is expressed in reference to the recommendations made by the Advisory Council on Social Security. It could provide an index for harmonizing economy with social security systems and for keeping a proper balance between public and private activities to maintain a vigorous and stable society to set the goal of limiting the national burden rate up to 50%. This idea is grounded on the following facts:
As explained above, there are diversified arguments about the national burden rate, although some estimate that the rate could be an index for keeping a proper balance between public and private activities. It is therefore necessary to discuss social security taking the various opinions into considerations (Figure 2-3-13). (Please refer to the Columns on "Net Burden Rate," "Relationship between Taxes and Social Security Burdens and Savings" and on "International Comparison of the Social Security Benefit Expenditure.")
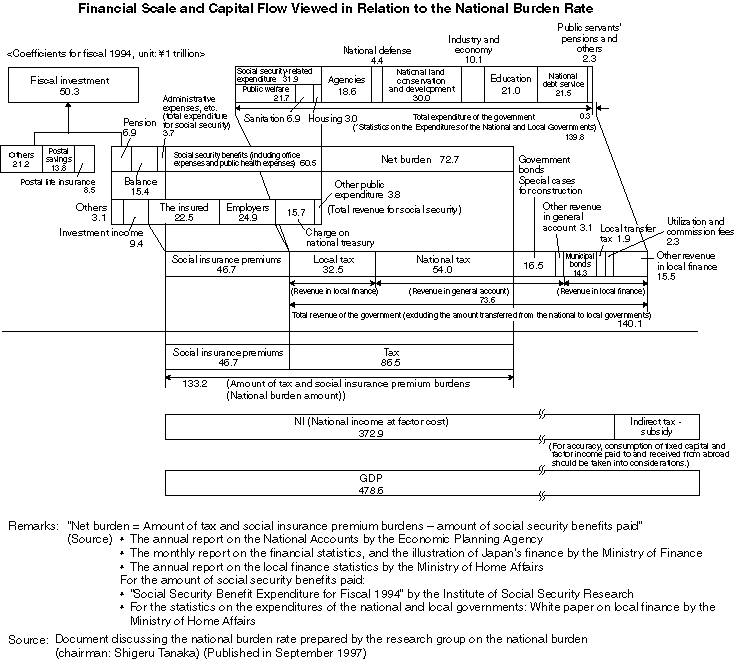
Column
People pay taxes, which provide financial resources for public services such as education and law enforcement, and they also bear social security burdens, which provide financial resources for social security benefits. Both taxes and social security burdens are used for public services and are imposed on people as obligations. To show the contribution of the public sector to national economy in terms of burdens shared by people, the ratio of taxation and social security burdens to the national income is calculated as the national burden rate.
Taxes and social security burdens provide financial resources for the payment of benefits under the social security systems such as medical, pension and welfare systems. Social security benefits represent money transferred from the government to households. Therefore, there are two types of burdens to be shared by people: burdens to receive social security benefits and burdens to enable the government to supply public goods. Some point out that to estimate the burdens actually shared by people, it is necessary to calculate the "net burden rate" by deducting the social security benefit rate (ratio of the social security benefit expenditure to GDP) from the ratio of taxation and social security burdens to GDP.
The ratio of taxation and social security burdens (\133.2 trillion) to GDP (\478.6 trillion) is 28% according to Japan's financial scale and capital flow of fiscal 1994. (There are, however, some points to be attended to such as fund raising through government bonds and securities and the surplus accumulated under the social security systems.) The social security benefit rate is 13% (\60.5 trillion), and the net burden rate is calculated to be 15% (\72.7 trillion).
|
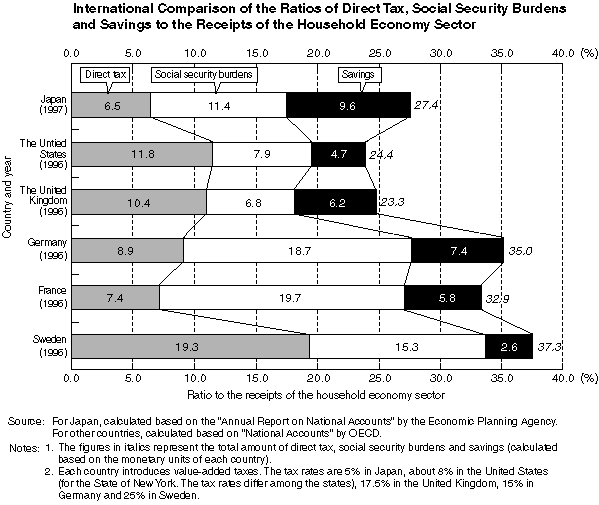
Column
The national burden rate is a ratio of taxation and social security burdens (social insurance premiums) to the national income. Apart from this rate, let us compare the ratios of direct taxes and social security burdens to the receipts of the entire household economy sector estimated in the National Accounts. The following figure graphically shows the international comparison data. However, because social security benefits provided in kind are included in the receipts of the household economy, it is not easy to make international comparisons in a simple manner. Although the figures themselves are different, the ratios show the same tendency as the national burden rate. Japan shows the ratio of 17.9%, which is the lowest among the six countries, followed by the United Kingdom and the United States. Sweden shows the largest ratio of 34.7%, followed by Germany and France.
For the ratio of savings to the receipts of the household economy, Japan shows the highest ratio (9.6%), reflecting the high savings rate and Sweden the lowest (2.6%). According to the public opinion poll about savings and consumption conducted by the Central Council for Savings Information in 1998, people deposit savings mainly for provision against sickness and emergencies (73% of the respondents selected this answer) and for preparing for their old age (55% of the respondents). For these purposes, people can also utilize medical insurance and pension insurance. However, as the major purposes of savings, respondents always give the same answers.
For the ratio of direct tax, social security burdens and savings to the receipts, it is 27.4% in Japan, which is higher than the ratios in the United States and the United Kingdom and nearer to the ratios in Germany, France and Sweden. The ratio in Sweden is 37.3% and compared with the ratio of direct tax and social security burdens to the receipts, the difference between Sweden and Japan is narrowed by 6.8 points.
Social security systems are social mechanisms for enabling people to provide against risks in their lives such as illness and aging. Savings are self-support measures for people to deal with uneasiness in their lives independently. It is up to the citizens of each country to which they place more importance as the entire society, to the social security systems financed through premiums and taxes or to self-support measures such as savings. As described in Chapter 1, social security systems are more rational and efficient than private measures for providing against risks in daily lives. |
Column
In this annual report, diversified international comparison data are shown to estimate the attainment levels of each country's social security systems. It is, however, very difficult to make accurate international comparisons, and international comparisons may sometimes lead to misunderstandings.
For example, let us look at the social security benefit expenditure of each country. The scale of the social security benefit expenditure has been expressed as the ratio to the national income. Based on the international comparison of these ratios among the United States, the United Kingdom, Germany, France, Sweden and Japan, Japan shows the lowest ratio among the six countries as shown in Figure 2-3-5 of the text. Because of the lowest ratio, it is sometimes estimated that the scale of Japan's social security benefit expenditure is small or Japan's social security level is lower than the other five countries. Is this really true?
Figure 2-3-4 shows the total amount of the social security benefit expenditure. For the total amount, Japan shows the second largest value following the United States and beating Germany, France, etc. (The amount is about seven times as large as that in Sweden.) Japan is on the higher level than the United Kingdom also for the per-capita social security benefit expenditure.
The ratio to the national income only shows the relative scale of the target (the social security benefit expenditure in this case) to the national income of each country. The scale of each country's social security benefit expenditure and social security level cannot be estimated based on the ratio.
Besides it should be noted that the social security mechanisms and systems themselves differ among countries according to their socioeconomic systems, histories and nationalities. Only for the pension system, the kinds of pension, the ages at which people start receiving pensions, payment levels, qualifications, etc. are different among countries. Depending upon the progress of aging and when the pension system was founded, the pension maturity (ratio of beneficiaries to the insured) differs and the total payment of pensions accordingly differs among countries.
Furthermore, it should be noted that the national income and the social security benefit expenditure are calculated according to different methods. The national income is calculated under the System of National Accounts (SNA) and represents the total added values in the national economic activities in terms of distribution. The national income is therefore influenced by economic situations (economic booms and depressions). Even if the social security benefit expenditure remains on the same level, its ratio to the national income will rise if the national income decreases because of an economic depression. To calculate the national income, the consumption of fixed capital and direct tax are deducted from the gross domestic product (GDP). For international comparison of the relative size of the social security benefit expenditure to the economic scale, it would be better to utilize its ratio to GDP. (In the United States and in Europe, the ratios to GDP are generally utilized.) |