1-1. Present Benefits and Burdens
(Benefits and burdens at an average household)
Social security benefits and burdens were outlined in the preceding section in relation to a life cycle. In this section let's look at the present situations concerning social security benefits and burdens in relation to household economy.
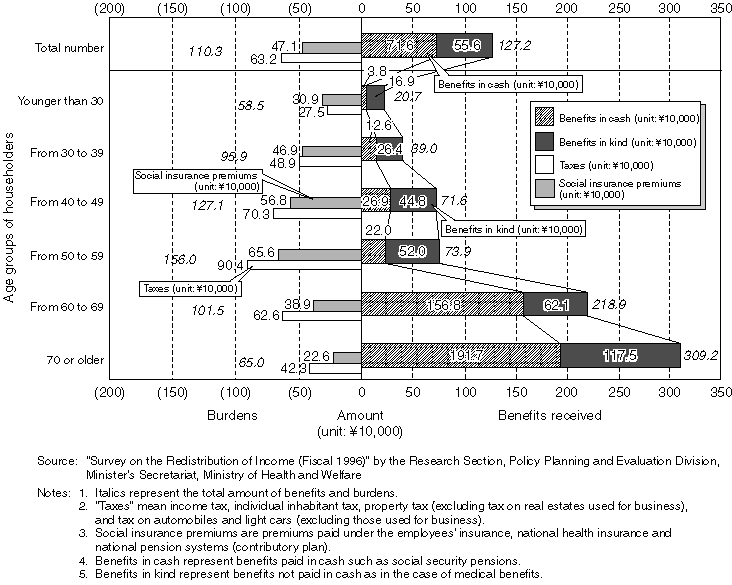
According to the survey on income redistribution conducted by the Ministry of Health and Welfare in 1996(Note), a household receives the following social security benefits in a year: \716,000 as benefits in cash including public pensions and public servants' pensions and \556,000 as benefits in kind such as medical benefits, which amount to \1,272,000 in total. For burdens, a household pays \632,000 as direct tax (income tax, individual inhabitant tax, property tax, etc.) and \471,000 as social insurance premiums (for public pension insurance, medical insurance, etc.). It should be noted that taxes serve as financial resources for diversified governmental expenditures including the payment of social security benefits (Figure 2-2-1).
(Note)
The Ministry of Health and Welfare has been conducting the survey on income redistribution to obtain clear data about the redistribution of income promoted through the social security systems and taxation and to utilize the data as the basic reference materials for making and implementing health and welfare administration plans. In the survey, comparisons are made between the initial income before receiving social security benefits and paying taxes and social insurance premiums and the redistributed income after receiving the benefits or sharing the burdens. From 1962 to 1972, the survey was conducted every five years, and has been conducted every three years since 1972. The latest survey was conducted in 1996, targeting 10,000 households among the households targeted in the Comprehensive Survey of the Living Conditions of People on Health and Welfare. The income redistribution survey is unique in that it examines social security benefits in a wide range including the acquisition of data on the amount of benefits provided in kind for medical care.
Figure 2-2-1. Social Security Benefits and Burdens per Household

(Social security benefits by age groups of householders)
For social security benefits by age groups of householders, every age group receives some social security benefits, but there are large differentials between the benefits received by households whose heads are younger than 60 years old and those whose heads are aged 60 or older.
For the younger households, the amounts of benefits they receive in a year are between \207,000 to \739,000, falling below the annual average of all the households (\1,272,000 per household). As much as 60 to 80% of the benefits are received in kind mostly for medical care and also for childcare services.
For the older households, the amounts of benefits each of them receives in a year are between \2,189,000 to \3,092,000, far exceeding the average of all the households, and as much as 60 to 70% of the benefits are received in cash such as public pensions and public servants' pensions.
As explained above, households whose heads are elderly people receive large benefits mostly in cash such as public pensions and public servants' pensions. However, households whose heads are young also receive benefits mostly in kind, which are mainly for medical care (Figure 2-2-1).
(Social security burdens by age groups of householders)
For taxes and social insurance premiums to be paid by each household, both of them increase as the householder gets old. The burdens, however, begin to decrease after reaching the highest level during the period when the householder is in his fifties. Such trend reflects the following facts (Figure 2-2-1):
- After the householder becomes 60 years old, he/she no longer needs to pay pension insurance premiums in principle, and his/her taxable income begins to decrease.
(Relationship between social security benefits and burdens by age groups of householders)
For the relationship between social security benefits and burdens by age groups of householders, the burdens (taxes and social insurance premiums) are larger in value than the benefits for the age groups younger than 60. For the older age groups, however, the benefits are much larger in value than the burdens (taxes and social insurance premiums). For age groups from 60 to 69, the amount of the benefits is twice as large as that of the burdens. For age groups from 70 to 79, the amount of the benefits is five times as large as that of the burdens (Figure 2-2-1).
1-2. Income Redistribution Function at the Household Level
(Income differentials in Japan)
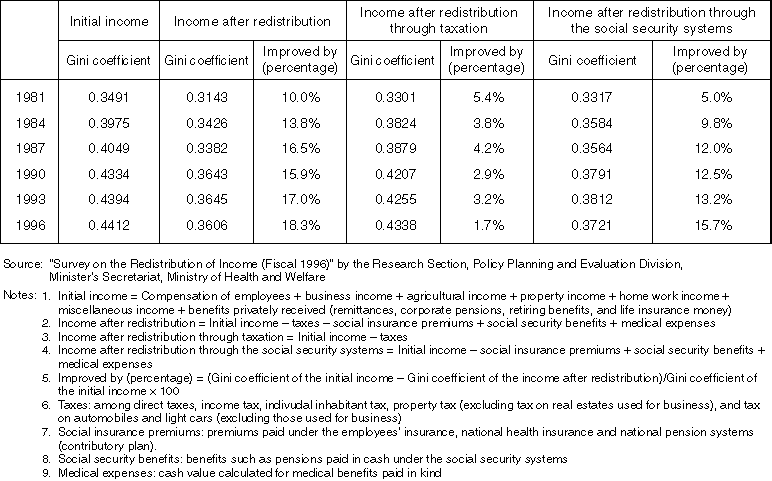
As one of their functions, social security systems contribute to income redistribution. The following is an analysis of the income distribution effect of Japan's social security systems. The analysis is made based on the Gini coefficient. (Please refer to the Column "Gini Coefficient.") For 1996, the Gini coefficients are 0.4112 and 0.3606 respectively for the total initial income of the entire households and for the total income after redistribution of the entire households. (The income after redistribution is calculated by deducting taxes and social insurance premiums from and adding social security benefits such as pensions and medical benefits to the initial income). Compared with the past figures, the coefficients have been slightly increasing since 1981. Because of such increase, some say that the income differentials have expanded among households. It is, however, necessary to pay attention to structural changes in society such as the progress of aging and the increase of households comprising only one person as the factors causing the rise of Gini coefficients (Table 2-2-2).
(Income redistribution effect of the social security systems)
For the same year, if the Gini coefficient of the income after redistribution is smaller than that of the initial income, it can be said that income differentials among households have been mitigated by successful income redistribution. For 1996, the Gini coefficient of the initial income is 0.4412 while that of the income after redistribution is 0.3606, which means improvement by 18.3% and that the income differentials have decreased towards the equalization of income. In comparison with the figure for 1981 (improvement by 10%), it can be said that the effect of the taxation and social security systems on the decrease of income differentials (= income redistribution effect) has been increasing.
For the social security systems only, the improvement percentage is 15.7% for 1996, and has been increasing year by year compared with the past. As shown by the increase, the social security systems have been greatly contributing to the decrease of income differentials among households (Table 2-2-2).
There are diversified household structures and income groups in Japan, and the social security benefits and burdens would differ by structures and groups. In the following paragraphs, let us examine the income distribution effect of the social security systems by income and age groups of householders.
Table 2-2-2. Income Redistribution Effect (Gini coefficients)
Column
Gini coefficients are calculated according to the following procedure.
First, put households in the order of their income, from the lowest to the highest. Then draw a graph with the cumulative percentage of the number of households as the axis of abscissas, and the cumulative percentage of income amount as the axis of ordinates. (This graph is called "Lorenz curve.") If income is distributed in a perfectly even manner among households, the Lorenz curve will represent a straight line extended from the origin, inclined by 45 degree (called "equality line"). As inequality increases among households, the Lorenz curve will be more deviated from the equality line. If one household monopolized income with others earning nothing, the Lorenz curve would represent the ABC line as shown in the following figure. The Gini coefficient represents the ratio of the bow area enclosed with the equality line and the Lorenz line to the triangle area below the equality line.
According to the result of the survey on income distribution the Gini coefficient of the income after redistribution is smaller than that of the initial income, and it is estimated that the income differentials among households have been decreasing through the social security systems towards the further equality of income. However, in the calculation of Gini coefficients based on household income, the difference in the household scale is not considered, and it must be noted that such neglect has set a certain limit on the discussions about income differentials. For example, if a household has an income that is twice as large as that of another household, there might be no income differentials on the individual level, if the number of household members of the former is twice as large as that of the latter. Although the Gini coefficient is the most popular among the measures to show the personal income distribution, there exist also other measures. Gini is an Italian statistician of the first half of the 20th century, and Lorenz is an American expert actively engaged in statistics also in the first half of the 20th century.
|
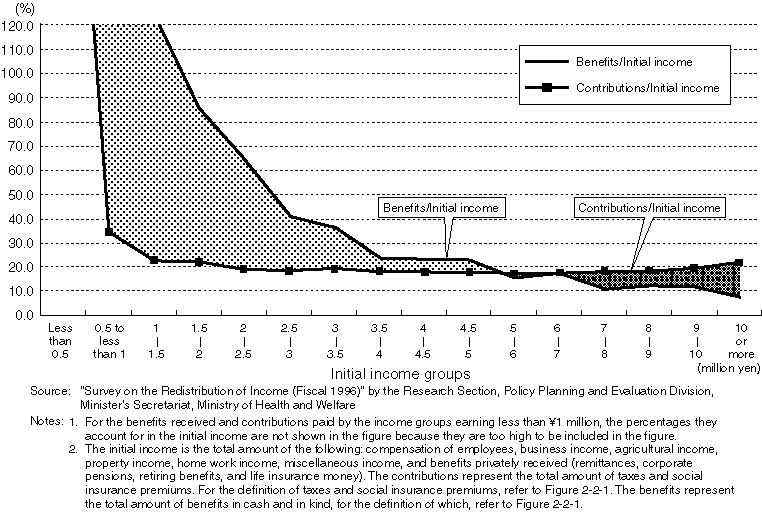
Figure 2-2-3. Ratios of Benefits/Contributions to the Initial Income (1996)
(Analysis by income groups - redistribution of income from the higher to the lower income groups)
For the initial income and income after redistribution by income groups of householders, the income after redistribution becomes larger as the household's income decreases (Figure 2-2-3). For the income groups earning less than \5 million, the income after redistribution is larger than the initial income and the difference is more striking for lower income groups. For the income groups earning \5 million or more, the initial income is larger than the income after redistribution. The analysis by income groups of householders shows that the income is redistributed from the households earning \5 million or more to those earning less than \5 million.
(Analysis by age groups of householders)
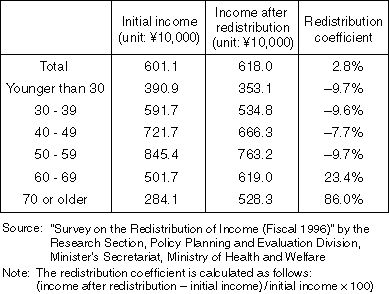
For the initial income and income after redistribution by age groups of householders, the initial income is larger than the income after redistribution for the age groups younger than 60, which implies that the amount of taxes and social insurance premiums exceeds the amount of social security benefits. For the older age groups (60 or older), the income after redistribution is larger than the initial income, which means that the amount of social security benefits exceeds the amount of taxes and social insurance premiums. Especially for households whose heads are aged 70 or older, the redistribution coefficient (ratio of the difference between the income after redistribution and the initial income to the initial income) is as high as 86.0%. The analysis by age groups of householders thus shows that the income is redistributed from the households of working generations to those of older generations (Table 2-2-4).
Table 2-2-4. Income Redistribution by Age Groups of Householders
(Based on the survey conducted in 1996)
(Analysis concerning the specific kinds of households)
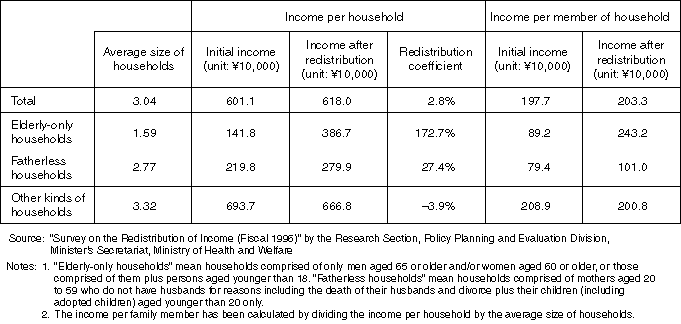
For the specific kinds of households, the initial income is \1.418 million while the income after redistribution is \3.867 million for elderly-only households (households comprising of men aged 65 or older and/or women aged 60 or older, or of them plus persons aged younger than 18). The redistribution coefficient, which shows the scale of difference between the initial income and the income after redistribution is as high as 172.7%.
For fatherless families, the initial income is \2.198 million and the income after redistribution is \2.799 million. The redistribution coefficient is 27.4% (Table 2-2-5).
Table 2-2-5. Income Redistribution by Household Kinds (Based on the survey conducted in 1996)
1-3. Income Redistribution at the Individual Level
(Analysis of per-capita income by age groups of household members)
Even if the amount of income of a household is the same as that of another household, the amount of money distributed to each of the household members might differ between the two households depending upon their sizes. Taking this into consideration, let us estimate the per-capita income by age groups of household members based on a certain set of assumptions, using the data about the household income and the sizes of households obtained from the Survey on the Income Redistribution conducted in 1996. In calculating the income per household member, it must be noted that the amount of money required for living and the amount of social security benefits received by each household member differ depending upon the member's age. For example, the living expenses including food expense would be different between adults and children. Besides medical expenses would differ by age groups or by individuals. Here, it is first calculated how much money will be required as living expenses by age groups of household members based on the criteria for the calculation of living expenses by age groups to be used for the provision of public assistance. Then the distribution ratios of the household income are calculated for each age group of household members. Based on the calculation results, the income per household member will be estimated and the estimates will be analyzed.
For the initial income, the per-capita income increases as household members get older. The per-capita income, however, begins to decrease when they become 30 years old and continues declining until they become 40. After they become 40, the per-capita income starts rising once again, reaching its peak while the members are in their fifties, and rapidly declines after they become 60. If the average of all the age groups is set to be 100, the per-capita income will be 96 for the group aged 40 to 44 and will be 66 for the groups aged 65 or older. Among the working generations, the per-capita income of the groups aged 30 to 49 is on the lowest level, reflecting the fact that these are groups who have to spend greater living expenses for raising their children (Figure 2-2-6).
For income after redistribution, the per-capita income is almost the same for all the age groups younger than 60. For the groups aged 60 or older, the per-capita income after redistribution is below the level of that of the group aged 50 to 59, but is above the average of all the age groups. If the average of all the age groups is set to be 100, the per-capita income after redistribution will be 87 for the group aged 40 to 44, 111 for the group aged 65 to 69, and 117 for the group aged 75 to 79. For older age groups, the per-capita income has been increased after redistribution thanks to pensions, medical benefits, etc. On the contrary, for the groups aged 30 to 39, the per-capita income is below the average of all the age groups due to the burdens imposed on them including taxes and social insurance premiums (Figure 2-2-6).
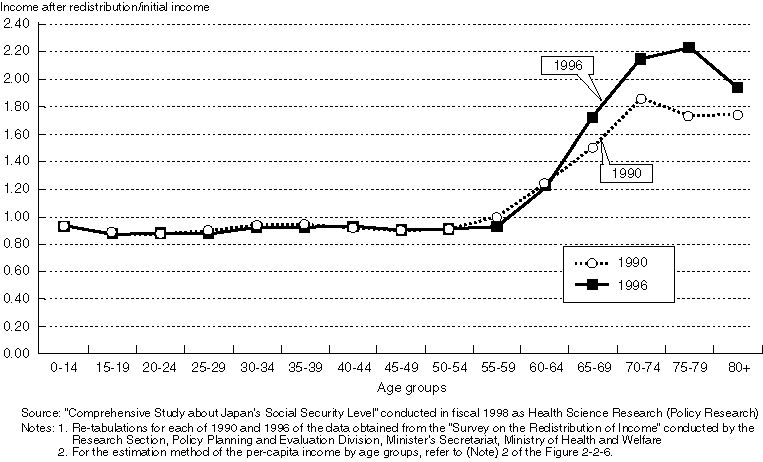
Similar results have been obtained from the analysis of the data collected in the "Survey on the Redistribution of Income" conducted in 1990. Comparing the data of 1990 with the data of 1996, the ratios of the income after redistribution to the initial income are almost the same for all of the age groups younger than 65, as shown in Figure 2-2-7. For groups aged 65 or older, however, the ratios are higher for 1996 than for 1990, which implies that more improvements were made through income redistribution in 1996 than in 1990.
Figure 2-2-6. Per-capita Income by Age Groups
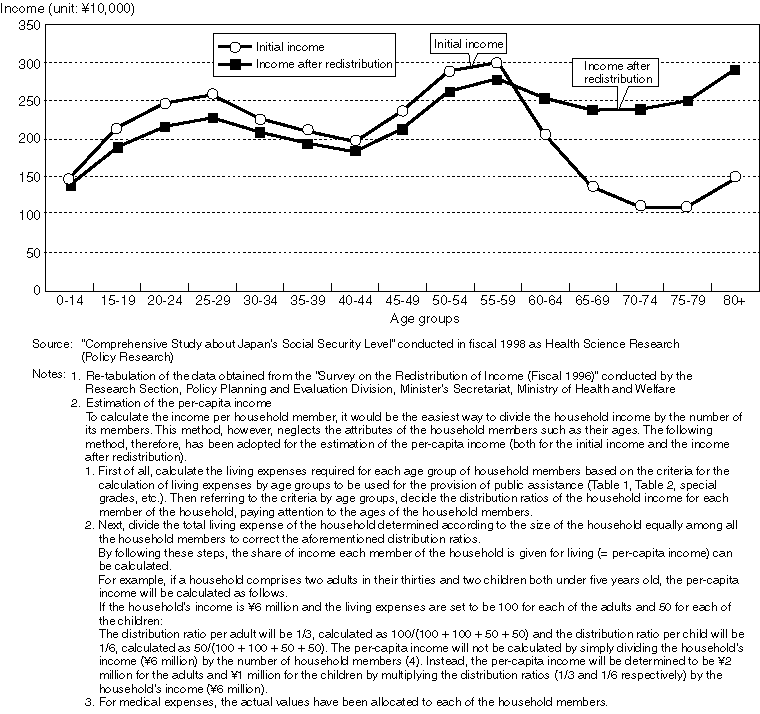
Figure 2-2-7. Income Redistribution Effect for Each Household Member by Age Groups
(Ratio of income after redistribution to the initial income)
1-4. Contributions of the Social Security Systems to Income Distribution, and the Related Problems
(Contributions of the social security systems)
As mentioned above, the social security systems have been contributing to the income distribution mainly among different income groups and age groups. In addition, the systems are supporting the specific kinds of households such as elderly-only households, households needing special protection and fatherless households through their income distribution function. The function is useful for decreasing income differentials among households, and for supporting the lives of low-income, elderly-only or fatherless households. The effect of the income distribution is especially beneficial for elderly-only households, even compared with the effect produced on fatherless households.
(Reasons for the greater effect on elderly-only households of income redistribution through the social security systems)
On the household level as well as on the individual household member level, the effect of income redistribution produced through the social security systems is especially great for elderly-only households and for the elderly.
For the reasons, the pension level has been raised and the percentage that pensions account for in the income of the elderly has been increasing; and the medical expenses of the elderly are about five times as large as the medical expenses of the younger age groups. Besides most of the social insurance premiums, which provide financial resources for pensions and medical expenses, are paid by the working generations.
Figure 2-2-8. Financial Resources for the Social Security Benefit Expenditure (For fiscal 1996)
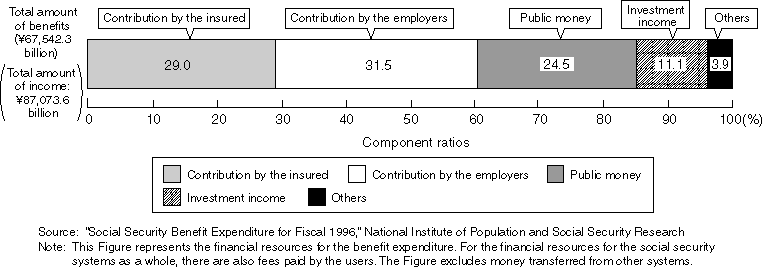
As described in 1-3 above, comparing people in their thirties and forties with elderly people, the elderly generations tend to receive more after income redistribution through the social security systems than the younger generations, if benefits in kind such as medical benefits are included in the income after redistribution. The people in their thirties and forties are working in society as central labor power, and have to provide financial resources for social security benefits by paying taxes and social insurance premiums. They also have to bear the costs for child rearing or for purchasing houses. In view of the further aging of society and the decrease in the number of children, it is required to review the medical security for the elderly based on the analysis of the income redistribution survey. Besides it should be considered what benefits and burdens are desirable in the pension system and whether social security benefits and burdens are shared in a fair manner between working and elderly generations.
In addition to income redistribution through the social security systems, private transfer of money should also be taken into considerations in searching ways to desirable or fair sharing of social security benefits and burdens between elderly and working generations. Elderly generations, who are receiving pensions, etc., are in return giving financial support to working generations in diversified forms: educational expenses, costs for purchasing houses or for marriage, etc. Besides the elderly eventually leaves their properties to the younger generations as heritage.
1-5. Taxes and Social Security Burdens in Household Economy
(Social security and people's burdens)
Social security benefits are mainly financed from taxes (public money) and social insurance premiums (paid by the insured and the employers) (Figure 2-2-8).
For expressing the scale of social security burdens, the "ratio of taxation and social security burden" (ratio of the total amount of taxes and social insurance premiums paid by people to the national income) has been often utilized. The ratio is 37.4% for fiscal 1998. It is sometimes argued that if the ratio reaches 50%, it means that a half of the household income will be collected as taxes and social insurance premiums.
The ratio, however, is a "macro" figure set on the level of the entire national economy. Social security burdens are not only born by households but also by other different entities such as companies. Then on a "micro" level (on the household economy level), how much each household shares the burdens and what changes have been made regarding the burdens? In the following paragraphs, let us first make an analysis of the issue based on the results of "Family Income and Expenditure Survey". (In the statistical survey, only direct taxes(Note) are regarded as the taxes paid by households. Consumption taxes paid indirectly by them are ignored.)
(Present situation and changes concerning taxes and social insurance premiums in household economy)
According to the results of the "Family Income and Expenditure Survey" conducted by the Statistics Bureau of the Management and Coordination Agency in 1998, the actual income of a worker's household (household the head of which works for a company, governmental agency, school, factory or merchant) is 588,916 per month on the average. Of the amount, the disposable income is \495,887. The monthly amount of expenses other than the living expenditure, including direct taxes and social insurance premiums, amounts to \93,029, which accounts for 15.8% of the actual income. Of the expenses, the earned income tax amounts to \20,876 (3.5% of the actual income), other taxes(Note 1) to \22,979 (3.9% of the actual income), and social insurance premiums to \49,021 (8.3% of the actual income) (Figure 2-2-9).(Note 2)
(Note)
In the "Family Income and Expenditure Survey," the following are included in direct taxes: earned income tax, individual inhabitant tax, and other taxes (property tax, real estate acquisition tax, donation tax, etc.)
Figure 2-2-9. Changes in the Structure of Japan's Household Economy
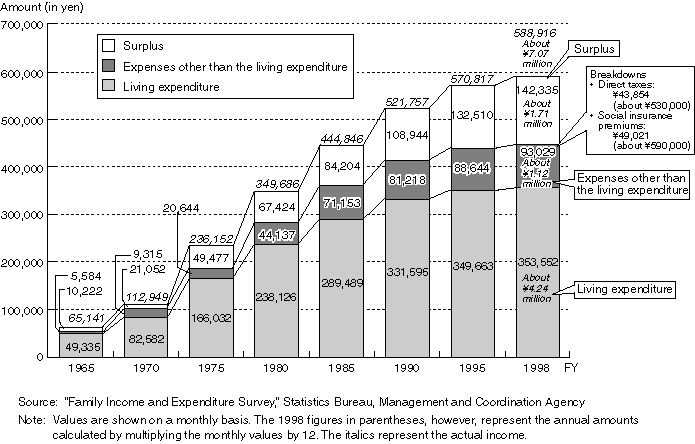
On an annual basis (calculated by multiplying the monthly income by 12), the income of an average worker's household amounts to about \7.07 million. Of the annual income, the disposable income amounts to about \5.95 million, the living expenditure to about \4.24 million and other expenses to about \1.12 million (direct taxes of about \530,000 plus social insurance premiums of about \590,000). Therefore, the household's balance (actual income minus actual expenditure) shows a surplus of about \1.71 million, which results in the increase of savings or decrease of debts.
For the changes from the past, the actual income and disposable income as well as the living expenditure and other expenses have been generally increasing. Comparing the year 1998 with the year 1970, the actual income and disposable income have increased by about five times, the living expenditure by about four times and other expenses by about 10 times. Throughout the period, the actual income of an average worker's household has been exceeding the actual expenditure, and the balance has been constantly showing the surplus that exceeds the amount of direct taxes and social insurance premiums to be paid (Figure 2-2-9).
Of the annual expenses other than the living expenditure, the direct taxes and social insurance premiums showed the following changes according to the results of the "Family Income and Expenditure Survey" conducted by the Statistics Bureau of the Management and Coordination Agency. The average, annual expenses amounted to \4,094 (7.7% of the actual income) in 1963, when the first data was obtained on the national average.(Note 3) In 1973, the expenses amounted to \1,4657, accounting for 8.8% of the actual income. Since 1975, the burden has been increasing: it amounted to \70,702 in 1985 (15.9% of the actual income) and is \92,875 (15.8% of the actual income) as of 1998. Compared with the year 1963, the expenses have increased by about 23 times in value and have doubled in terms of their ratio to the actual income (Figure 2-2-10).
(Note 1)
"Other taxes" represent individual inhabitant tax (\16,792) and other taxes (amounting to \7,652 in total, including property tax, real estate acquisition tax and donation tax)
(Note 2)
"Actual income" means income obtained from employers, operation of business or from side jobs. It doesn't include withdrawn deposits or the amount of money brought forward from the previous month.
(Note 3)
The Family Income and Expenditure Survey originates from the survey on consumer prices started in July 1946. The survey had been conducted targeting cities, but the target was expanded in July 1962 to include all the municipalities throughout the country. Therefore, the data on the national annual averages are available from 1963 onward. In this report, the changes in the results of the Family Income and Expenditure Survey are examined retrospectively to the data of 1963 at the maximum.
Figure 2-2-10. Ratio of Taxes and Social Insurance Premiums to the Actual Income Based on the Results of the Family Income and Expenditure Survey (For worker's households)
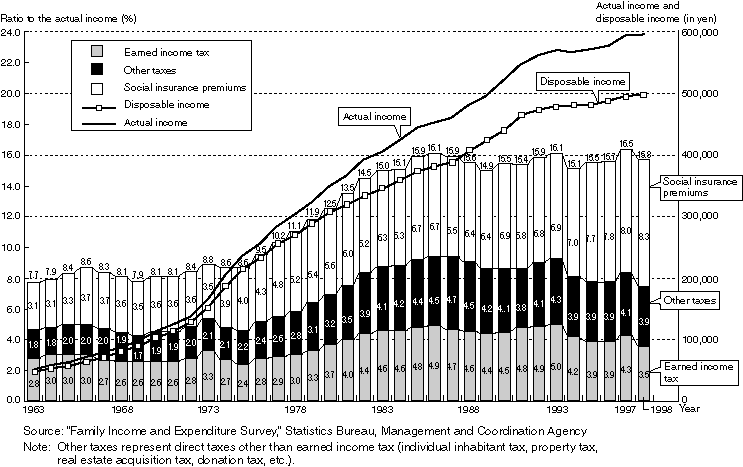
As shown in the figure above, the ratio of direct taxes and social insurance premiums to the actual income is 15.8% on the average (1998), which is quite different from the ratio of taxation and social security burden in national economy, calculated on the macro level (37.8% for fiscal 1998). Although the direct taxes and social insurance premiums to be paid by each household have been increasing, the amount of actual income has been also steadily increasing. As a result, the ratio of the direct taxes and social insurance premiums to the actual income has only doubled after as many as 35 years. The growth of the ratio has been quite moderate for the 35 years.
Even if each household has to pay more direct taxes and social insurance premiums, it will not exert a serious influence on the household economy so far as the increasing rate is below the growth rate of the actual income or the disposable income. The amount of social security benefits to be provided to each household has increased as much as by about 34 times from about \45,000 in 1963 to about \1.53 million in 1996(Note) on the average, while the amount of direct taxes and social security premiums to be paid by each household has increased by about 23 times from 1963 to 1998. Thus the social security benefits have shown more growth: they have been financed without more burdens rapidly imposed on each household.
(By age groups of householders)
According to the results of the Family Income and Expenditure Survey conducted in 1998, the households the heads of which are aged 50 to 59 bear the heaviest burdens among all the age groups of householders. Each of them pays as much as \122,480 on the average per month as direct taxes and social insurance premiums, which is by about \30,000 larger than the average amount paid by each of workers' households. However, because the age group earns as much as \685,228 per household, which is the largest actual income among all the age groups, the ratio of direct taxes and social insurance premiums to the actual income is 17.9% for the group. The ratio is only two points higher than the average per workers' household (15.8%). The younger the age groups are, the smaller the burdens become. The ratios of direct taxes and social insurance premiums to the actual income are 14.1% and 15.7% respectively for the group aged 30 to 39 and the group aged 40 to 49.
(Note)
Calculated by multiplying the per-capita social security benefit expenditure by the average number of household members (data obtained in the "Comprehensive Survey of the Living Conditions of People on Health and Welfare").
Figure 2-2-11. Household Economy by Age Groups of Householders (For workers' households, 1998)
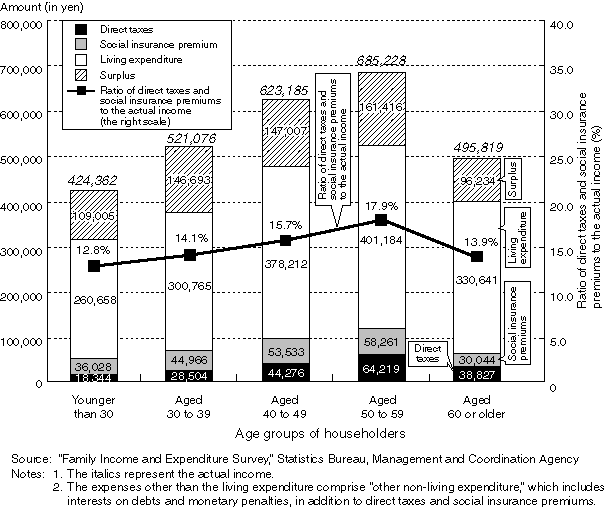
For social insurance premiums only, the ratios are around 8% for all of the age groups excluding the oldest group (aged 60 or older). This might be because social insurance premiums are collected at fixed rates from workers' households. All the age groups show certain amounts of surplus and have savings (Figure 2-2-11).
(By income groups)
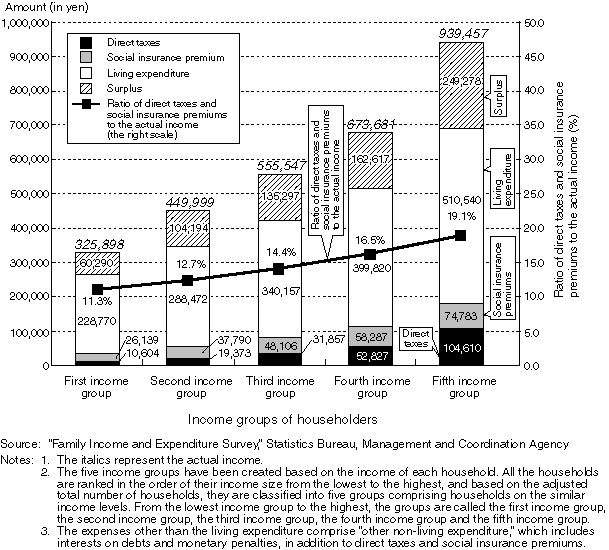
According to the results of the Family Income and Expenditure Survey conducted in 1998, the highest income group, which of course earns the highest actual income and disposable income, bears the highest burdens concerning direct taxes and social insurance premium among the five income groups(Note) of workers' households. The highest income group (the fifth income group) earns \939.457 as actual income and \759.818 as disposable income, while the group pays \179,393 as direct taxes and social insurance premiums, which accounts for 19.1% of the actual income. The lowest income group (the first income group) earns \325,898 as actual income and \289,060 as disposable income, and pays \36,743 as direct taxes and social insurance premiums, which accounts for 11.3% of the actual income. The amount of direct taxes and social insurance premiums paid by the first income group is about one-fifth of the amount paid by the fifth income group. For the percentage the burdens account for in the actual income, the first income group shows a figure that is about eight points below that of the fifth income group. All of the income groups have surplus, which exceeds the amount of direct taxes and social insurance premiums to be paid by each of the groups, and have savings (Figure 2-2-12).
(Note)
The five income groups have been created based on the income of each household. All the households are ranked in the order of their income size from the lowest to the highest, and based on the adjusted total number of households, they are classified into five groups comprising households on the similar income levels. From the lowest income group to the highest, the groups are called the first income group, the second income group, the third income group, the fourth income group and the fifth income group.
Figure 2-2-12. Household Economy by Income Groups of Householders (For workers' households, 1998)
2. International Comparison of Household Economy
2-1. Comparison of Household Economy Based on the Statistical Data of Each Country
(International comparison of taxes and social insurance premiums to be paid by each household)
According to the results of the Family Income and Expenditure Survey, etc., many people are feeling that payment of taxes and social insurance premiums are serious burdens for them. Comparing with households in other countries, are Japanese households bearing higher burdens?
It is not easy to compare the burdens of taxes and social insurance premiums among countries, because taxation systems and social security systems differ by countries and each country has its own way of conducting surveys to obtain statistical data on household economy, and its own definition of household economy. However in the following paragraphs, comparisons will be made between Japan and the following three countries: the United States, the United Kingdom and Germany based on the results of surveys on household economy announced by the countries. (Note)
(Note)
To make comparisons, the results of the following surveys have been referred to:
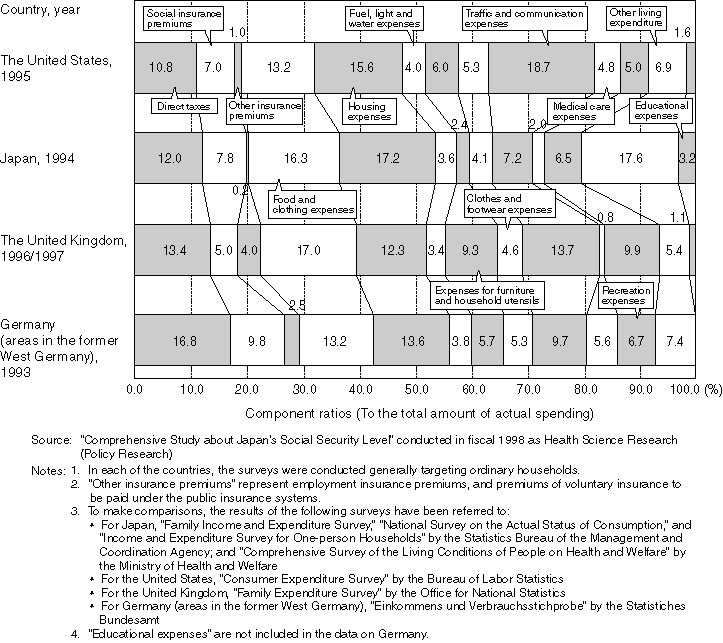
Figure 2-2-13. International Comparison of Household Economy
(Household economy in each country)
Data on household economy reveal differences in people's lifestyles among countries. For example, because Americans spend a lot of money on their automobiles, the traffic and communication expenses account for as much as about 18.7% in the total amount of actual spending. Japanese people spend a lot as social expenses and "other living expenditure" accounts for 17.6%, which is quite a large percentage compared with the percentages of "other living expenditure" of other countries.
In Japan, the ratio of the expenses other than the living expenditure (direct taxes and social insurance premiums) to the total amount of actual spending is 20.0%(Note), which is on almost the same level as the United States (18.9%). In the United Kingdom, the ratio is slightly higher (22.3%) and in Germany, the ratio is 29.1% and about nine points higher than the ratio in Japan. For social insurance premiums only, the ratio in Germany is only two points higher than that in Japan. In Germany, however, the premiums of voluntary insurance account for 2.5% and direct taxes account for 16.8% (four points higher compared with Japan) of the total amount of actual spending, which results in the difference (nine points). Between Japan and the United States, there are no remarkable differences in the ratio of social insurance premiums and direct taxes to the total amount of actual spending.
As explained above, Japanese households bear the burdens of social insurance premiums and direct taxes almost on the same level as Americans but on the lower level than British or German people (Figure 2-2-13).
(Note)
Here, estimates on the household economy of all types of households including those that are not workers' households have been utilized to calculate the ratio of expenses other than the living expenditure (= direct taxes and social insurance premiums) to the total amount of actual spending. The total amount of actual spending is calculated by subtracting the amount of surplus (savings, etc.) from the actual income. In Japan the total amount of actual spending is smaller than the actual income because of the existence of a certain amount of surplus. Therefore, the ratio of direct taxes and social insurance premiums to the total amount of actual spending is higher than the ratio of direct taxes and social insurance premiums to the actual income.
(International comparison of household economy by income groups)
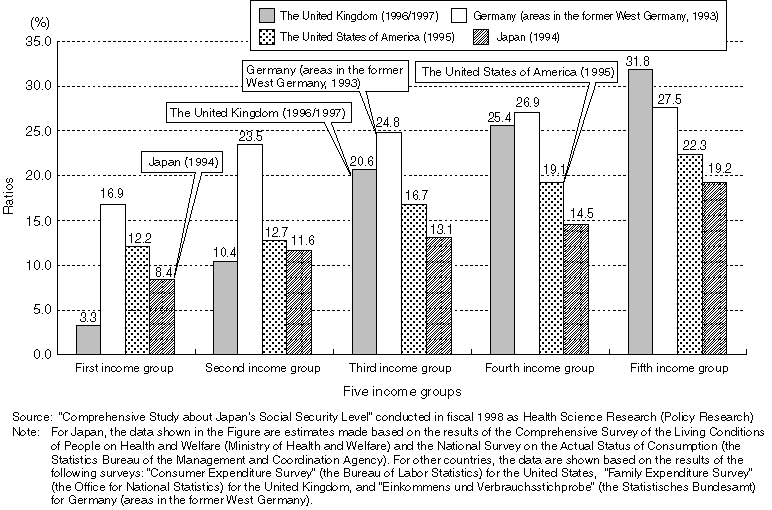
For the ratios of direct taxes and social insurance premiums to the actual income calculated for each of the five income groups of households, the higher the income is, the higher the ratio becomes in all of the countries. In Japan, the income groups show the following trends.
For the first income group (the lowest income group), the ratio is 8.4% and is higher than the ratio shown by the same income group in the United Kingdom. It is about half of the ratio in Germany (16.9%) and is by about four points lower than that in the United States (12.2%). Also for the second income group, the ratio shows the same trend: higher than in the United Kingdom and lower than in Germany and the United States. For the third and the higher income groups, Japan shows the lowest ratios. For the third income group, it is 13.1% in Japan, which is by about 11 points and seven points lower than the ratios in Germany (24.8%) and the United Kingdom (20.6%) respectively. Besides it is by about four points lower than that in the United States (16.7%). Also for the fifth income group earning the highest income, the ratio is 19.2% in Japan and is by about three points lower than the ratio in the United states (22.3%), which is the third highest among the four countries (Figure 2-2-14).
2-2. Taxes and Social Insurance Premiums Paid in Each of the Countries
(International comparison of the taxes and social insurance premiums paid by certain households)
As mentioned above, according to the statistical data of each country, the burdens that Japanese households bear in the form of direct taxes and social insurance premiums are smaller compared with other countries. The statistical data, however, have not been obtained under the same conditions: the targets are different or the basic attributes of the targeted households are different including the household size and composition. It is therefore difficult to conclude that the burdens are relatively small in Japan based on the statistical data.
Figure 2-2-14. International Comparison of the Ratios of the Expenses Other than the Living Expenditure to the Actual Income
In the following, regarding certain households (salaried households each comprising a couple and two children), the ratios of taxes and social insurance premiums to the income will be compared by income groups of the households among the countries.
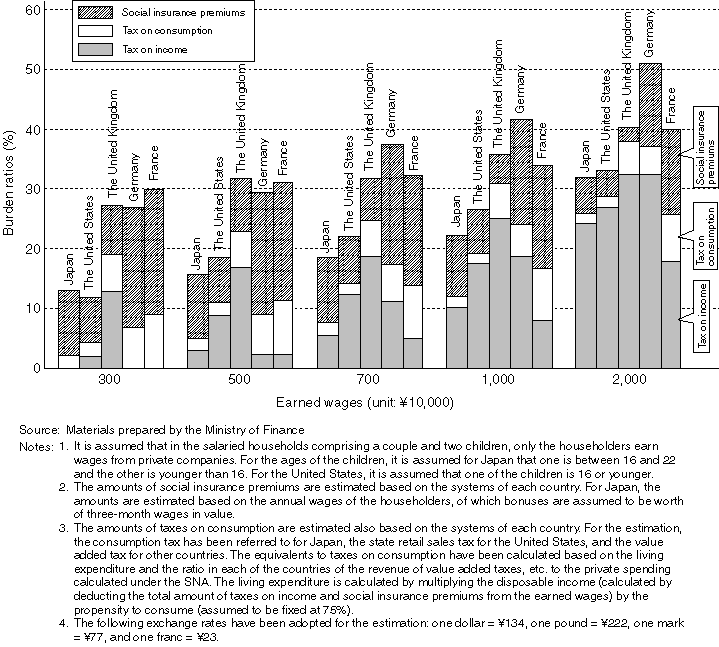
For the ratios of taxes (taxes on income plus taxes on consumption calculated based on diversified assumptions) and social insurance premiums to the income (hereinafter called "the burden ratio(s)") by earned wages, Japan shows lower ratios compared with other developed countries (the United States, the United Kingdom, Germany and France). For income groups earning \3 million, the effective burden ratio is slightly above 10% in Japan, which is almost on the same level as the ratio in the United States and is by more than 50% lower compared with other countries. Also for income groups earning \5 million and \7 million, the burden ratios are below 20% and slightly lower than the ratios in the United States. Although the differences between Japan and the United Kingdom and France become smaller for the higher income classes, the burden ratio is about half of the ratio in Germany (about 37%) for the income group earning \7 million. Even based on the same standard, Japanese households bear smaller burdens compared with the United States and the European countries (Figure 2-2-15).
Figure 2-2-15. Ratios of Taxes on Income and Consumption to the Income (Burden ratios)
(By earned wages for salaried households comprising a couple and two children)
(International comparison of workers' social insurance premium rates)
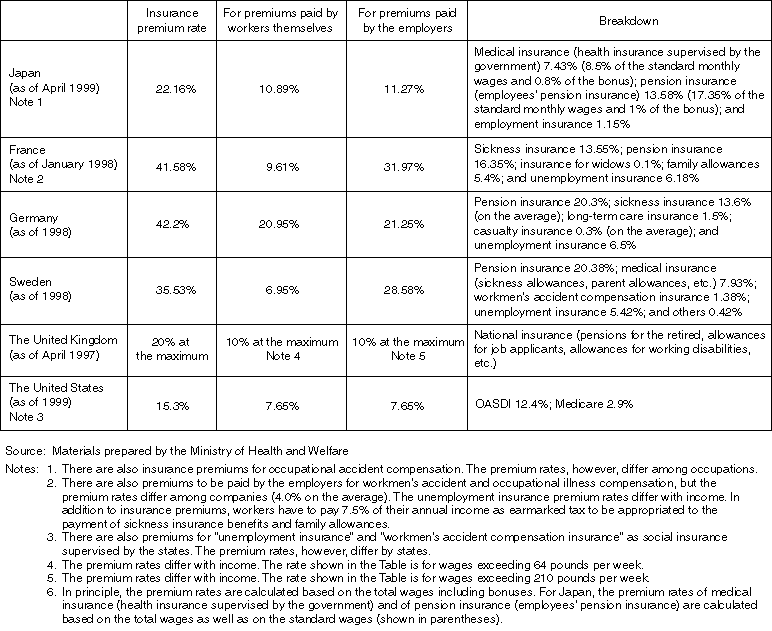
Workers' social insurance premiums are paid not only by workers themselves but also by their employers. The rate of social insurance premiums (for receiving pensions, medical services, etc.) is about 22% in Japan, which is lower than those in the European countries, but is higher than those in the United Kingdom and in the United States. The social insurance premium rate is low in the United States mainly for the following reasons: the country does not have a public medical insurance system covering all the citizens, and private companies provide medical insurance, etc. In the United Kingdom, the rate is low because a social security system called National Health Service (NHS) is provided for medical services, financed through tax revenues.
For the European countries excluding the United Kingdom, the rates are higher than in Japan in Germany, France and Sweden. The rate is especially high in Germany, regarding the social insurance premiums to be paid by workers themselves. In France, people contribute 7.5% of their annual income as earmarked tax to be appropriated for the payment of sickness insurance benefits and family allowances, and the rate of sickness insurance premiums to be paid by workers themselves has been reduced. In Sweden, the medical services are financed not through social insurance premiums but through provincial taxes. The rates of social insurance premiums to be paid by the employers are high in Sweden, France and Germany. The rate of social insurance premiums to be paid by the employers is by about 40 to 50% lower in Japan than in these countries.
As explained above, the social insurance premium rate is higher in Japan than in the United States depending mainly upon private insurance and in the United Kingdom financing social insurance mainly through tax revenues. However, the rate is lower than in Germany, France and Sweden (Table 2-2-16).
Table 2-2-16. International Comparison of Social Insurance Premium Rates (For workers)
