Index / Back / Next

10)  Fathers on day off and their involvement in child rearing

78.8% of the fathers answered they "usually spend days off with family". Other than this, there is a higher percentage who feels burdensome about child rearing. (Table 21)

Table 21  How Fathers spend on day off (Unit: %)
  Total Usually with family With family, but do different activities including hobbies Usually go out alone Sleep and rest at home most of the day Mostly go to work; work at home Others
Total (100.0) (78.8) (4.1) (4.5) (5.6) (3.9) (2.5)
100.0 100.0 100.0 100.0 100.0 100.0 100.0
Feel burdensome 86.1 85.2 90.4 90.2 92.2 86.9 88.1
  Physical burdens 32.0 31.6 32.5 29.6 36.2 35.0 36.3
Financial burdens 25.9 25.3 27.7 28.8 30.2 23.4 28.5
Lack of free time 58.7 58.3 61.9 61.1 61.2 59.1 58.4
Lack of partner's involvement in child rearing 6.2 2.7 18.6 21.2 26.4 12.7 14.1
Parental disagreement in discipline 9.5 7.9 16.3 17.1 16.8 10.5 14.6
Unable to work or do housework enough 19.9 18.9 22.6 22.2 23.5 27.4 23.5
Concerned about what people talk about the child 5.1 4.9 5.9 5.8 6.7 5.0 6.5
Constant tension due to the active child 22.8 22.4 23.7 24.2 25.2 22.5 26.9
Unable to build good relationship with other parents 1.2 1.1 1.6 1.0 1.9 2.1 2.3
No caregiver when temporary childcare is needed 12.0 11.7 13.9 10.7 15.0 12.7 13.7
Disobedience of the child 21.7 21.3 25.2 23.7 24.1 20.7 23.9
Being prone to illness 4.1 3.8 4.9 5.3 4.8 4.9 5.4
No doctor available in the neighborhood for the child taken ill suddenly 3.5 3.5 3.1 3.3 3.8 3.8 4.7
Concerned about the growth of the child 7.2 7.1 7.0 6.5 7.9 8.3 7.0
Do not know how to discipline the child 8.7 8.6 10.4 10.4 8.2 8.2 9.2
No affection to the child 0.3 0.3 0.5 0.6 0.4 0.4 0.6
Others 3.0 2.9 3.3 2.9 3.1 3.0 4.4
Do not feel burdensome in particular 13.1 14.0 9.2 9.4 7.2 12.3 10.7
Notes:
1)  Calculated based on children living with father
2)  Whether or not feeling burdensome "unknown", and how fathers spend day off "unknown" are also included in the total.
3)  Multiple answers in regards to burdens and worries.

With regard to how much fathers are involved in child caretaking, percentages of those who "always" or "sometimes" help prepare meals increased from the previous survey; on the other hand, those who "always" take baths or play with the child(ren) dropped from last time, and "sometimes" increased. (Table 22)

Table 22  Changes in the involvement of father in child caretaking (Unit: %)
  1st survey 2nd survey 3rd survey
Help with meals
(Care at mealtime)
100.0 100.0 100.0
  Always 3.3 9.2 12.1
Sometimes 40.1 51.8 57.2
Rarely 29.6 25.3 21.8
Not at all 24.5 11.6 7.1
Unknown 2.5 2.0 1.8
Taking baths with the child
(Bathtime care)
100.0 100.0 100.0
  Always 42.0 36.2 32.5
Sometimes 40.9 48.7 53.8
Rarely 9.2 9.2 9.5
Not at all 6.6 4.8 3.5
Unknown 1.2 1.2 0.7
Taking care of excrements
(Changing diapers)
100.0 100.0 100.0
  Always 6.2 8.4 7.6
Sometimes 58.9 55.5 54.2
Rarely 21.7 22.4 23.9
Not at all 11.5 12.0 13.0
Unknown 1.8 1.6 1.2
Help putting on clothes ... ... 100.0
  Always ... ... 9.2
Sometimes ... ... 64.1
Rarely ... ... 20.4
Not at all ... ... 5.1
Unknown ... ... 1.2
Play with the child
(Entertaining the child at home)
100.0 100.0 100.0
  Always 43.1 45.0 38.6
Sometimes 51.0 49.0 55.5
Rarely 3.8 4.1 4.3
Not at all 0.6 0.6 0.7
Unknown 1.5 1.4 0.9
Take the child out of the house 100.0 100.0 ...
  Always 7.9 15.9 ...
Sometimes 61.2 66.5 ...
Rarely 21.1 13.0 ...
Not at all 8.1 3.2 ...
Unknown 1.7 1.4 ...
Put the child to sleep 100.0 100.0 ...
  Always 7.8 11.2 ...
Sometimes 42.7 39.2 ...
Rarely 28.5 28.6 ...
Not at all 18.5 19.1 ...
Unknown 2.1 1.9 ...
Notes:
1)  Calculated based on responses from each survey only where children live with father.
2)  Each item is from the Third Survey, and ( ) were reported in the previous survey.

90% of the fathers "always" or "sometimes" "play with the child"; accounting for the highest percentage of the involvement of the fathers in child care. (Table 23)

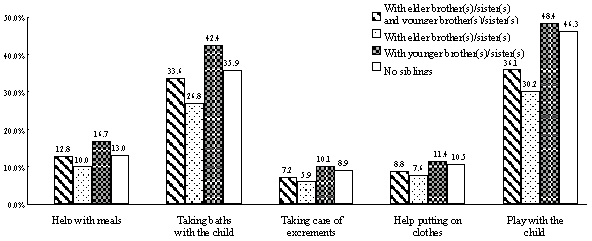
In the breakdown of with or without siblings, higher percentages of the fathers are "always" involved in child care if the child has "only younger brother(s) and/or sister(s)" and "no siblings". (Figure 16)

Table 23   Involvement of fathers in child care in the breakdown of siblings
(Unit: %)
  Total With elder brother(s)/sister(s) and younger brother(s)/sister(s) With elder brother(s)/sister(s) With younger brother(s)/sister(s) No siblings
Help with meals 100.0 100.0 100.0 100.0 100.0
  Always 12.1 12.8 10.0 16.7 13.0
Sometimes 57.2 58.0 55.4 58.6 58.9
Rarely 21.8 21.0 24.3 18.3 20.1
Not at all 7.1 6.8 8.4 4.9 6.3
Unknown 1.8 1.3 1.9 1.6 1.8
Taking baths with the child 100.0 100.0 100.0 100.0 100.0
  Always 32.5 33.6 26.8 42.4 35.9
Sometimes 53.8 54.5 58.3 47.2 50.3
Rarely 9.5 9.1 10.7 7.4 8.9
Not at all 3.5 2.3 3.5 2.2 4.2
Unknown 0.7 0.4 0.8 0.9 0.6
Take care of excrements 100.0 100.0 100.0 100.0 100.0
  Always 7.6 7.2 5.9 10.1 8.9
Sometimes 54.2 54.0 50.7 58.3 57.3
Rarely 23.9 23.3 26.7 20.8 21.5
Not at all 13.0 14.2 15.3 9.6 11.2
Unknown 1.2 1.3 1.3 1.2 1.1
Help putting on clothes 100.0 100.0 100.0 100.0 100.0
  Always 9.2 8.8 7.6 11.4 10.5
Sometimes 64.1 63.7 62.0 66.7 66.0
Rarely 20.4 21.3 23.2 17.1 17.9
Not at all 5.1 5.0 6.0 3.5 4.5
Unknown 1.2 1.2 1.2 1.3 1.1
Play with the child 100.0 100.0 100.0 100.0 100.0
  Always 38.6 36.1 30.2 48.4 46.3
Sometimes 55.5 57.3 62.2 47.6 49.3
Rarely 4.3 5.2 5.7 2.5 3.1
Not at all 0.7 0.6 0.9 0.5 0.5
Unknown 0.9 0.8 0.9 1.0 0.8
Note:  Calculated based on children living with father.

Figure 16   Child care fathers "always" involved in according to the breakdown of siblings

Figure 16 Child care fathers always involved in according to the breakdown of siblings
Note:  Calculated based on children living with father.


Return To Top
Index / Back / Next