Index / Back / Next

9)  Attitudes towards child rearing

99.0% of the respondents said they found "satisfaction" in child rearing.

In the breakdown of the satisfaction, the "taking pleasure in the growth of the child" and "contact with the child is valuable" answers showed higher percentages. (Table 16)

Table 16   Advantages of child rearing (multiple answers)
(Unit: %)
  Second Survey
Total Had satisfactions No satisfaction in particular
  Family ties strengthened Contact with the child is valuable Everyday life became challenging Elder siblings got self esteem as elders Human network widened through rearing the child Viewpoint was broadened through rearing the child Others
Third Survey Total (100.0) (97.3) (67.0) (83.1) (48.7) (41.9) (32.8) (45.8) (5.1) (0.7)
100.0 100.0 100.0 100.0 100.0 100.0 100.0 100.0 100.0 100.0
Had satisfaction 99.0 99.2 99.4 99.4 99.4 99.2 99.5 99.4 99.0 75.3
  Family ties strengthened 56.6 57.0 68.8 59.6 66.4 56.4 64.0 64.9 59.6 14.8
Contact with the child is valuable 71.7 72.1 75.7 78.5 81.2 67.8 77.2 79.6 76.9 20.3
Everyday life became challenging 38.7 38.9 43.5 42.0 56.8 35.8 45.7 48.7 45.2 7.7
Enjoying the companionship between siblings 52.4 52.5 54.0 50.8 48.5 90.7 47.3 43.8 48.6 26.2
Human network widened through rearing the child 32.5 32.8 34.7 33.7 36.7 27.3 62.7 41.5 36.9 9.6
Viewpoint was broadened through rearing the child 37.7 37.9 40.9 40.0 45.8 26.8 50.4 59.2 51.0 10.0
Children make the family happy 66.9 67.2 73.6 70.3 75.8 68.3 71.1 72.1 69.8 26.6
Growth of the child is a comfort 81.7 82.0 84.9 85.6 88.3 77.7 86.0 88.1 85.4 37.3
Other 2.2 2.2 2.3 2.3 2.6 1.7 2.8 2.9 14.1 1.8
No satisfaction in particular 0.4 0.3 0.1 0.1 0.1 0.2 0.1 0.1 0.5 22.9
Notes:
1)  Calculated based on respondents from the Second and Third Surveys.
2)  Whether or not there were advantages are "unknown" is included in the total.
3)
(    )  means no changes in the advantage breakdown.

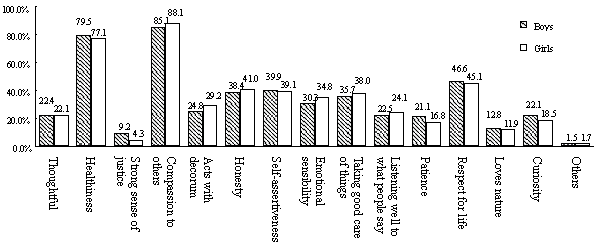
How do you want your kids to grow up? Many answers raised by the parents were "compassion to others", "healthiness", "respect for life" for both boys and girls. (Figure 15)

Figure 15   How do you want your kids to grow up? (multiple answers)

Figure 15 How do you want your kids to grow up? (multiple answers)

In the breakdown of burdens or worries about child rearing, "lack of free time" accounted for the highest percentage; followed by "physical burdens" from the First to Third Surveys. While "constant tension due to the active child" ranked third in the Second Survey, "financial burdens" took this place in the Third Survey. (Table 17)

Table 17   Burdens and worries about child rearing (multiple answers)
(Unit: %)
  1st survey 2nd survey 3rd survey
Total 100.0 100.0 100.0
Feel burdensome 79.7 85.5 86.2
  Physical burdens 40.0 39.4 32.0
Financial burdens 34.2 26.9 25.8
Lack of free time 55.8 64.0 58.6
Lack of time with partners 24.6 24.9 ...
Lack of partner's involvement in child rearing ... ... 6.2
Lack of familiar persons' understanding 5.6 6.0 ...
Parental disagreement in discipline ... ... 9.5
Unable to work or do housework enough 11.9 16.1 20.1
Concerned about what people talk about the child ... ... 5.2
Constant tension due to the active child ... 34.1 22.8
Being prone to illness 3.4 6.3 4.2
Unable to build good relationship with other parents ... ... 1.2
No caregiver when temporary childcare is needed ... ... 12.0
Disobedience of the child ... ... 22.0
No doctor available in the neighborhood for the child taken ill suddenly ... ... 3.5
Concerned about the growth of the child ... ... 7.2
Do not know how to discipline the child ... ... 8.7
No affection to the child ... ... 0.3
Others 6.0 3.9 3.0
Do not feel burdensome in particular 19.8 12.2 13.0
Notes:
1)  Calculated based on responses from the First to Third Surveys
2)  Whether or not feeling burdensome "unknown" is also included in the total.
3)  Those who answered yes to the question of whether or not feeling burdensome in the Third Survey were 91.6% mothers, 6.0% fathers, 1.6% both parents, other combination 0.5%, and 0.4% unknown.

In the breakdown of caregivers, there can be seen a huge gap among "financial burdens", "lack of free time", and "unable to work or do housework enough" in answers of burdensome or worries. (Table 18)

Table 18   Burdens and worries about child rearing in the breakdown of caregivers (multiple answers)
(Unit: %)
  Total Single caregiver since the First Survey Combination with nursery school teachers, etc. Combination without nursery school teachers.
Total (100.0) (12.3) (27.8) (59.9)
100.0 100.0 100.0 100.0
Feel burdensome 86.2 87.1 85.5 86.3
  Physical burdens 32.0 32.9 30.1 32.7
Financial burdens 25.8 23.0 32.8 23.1
Lack of free time 58.6 61.7 51.4 61.3
Lack of partner's involvement in child rearing 6.2 10.7 6.2 5.3
Parental disagreement in discipline 9.5 8.8 10.8 9.0
Unable to work or do housework enough 20.1 16.0 27.9 17.3
Concerned about what people talk about the child 5.2 5.8 4.3 5.4
Constant tension due to the active child 22.8 25.4 17.5 24.7
Unable to build good relationship with other parents 1.2 1.4 0.8 1.4
No caregiver when temporary childcare is needed 12.0 17.2 6.4 13.6
Disobedience of the child 22.0 21.2 19.8 23.1
Being prone to illness 4.2 3.7 7.3 2.9
No doctor available in the neighborhood for the child taken ill suddenly 3.5 3.6 3.8 3.3
Concerned about the growth of the child 7.2 6.4 5.9 7.9
Do not know how to discipline the child 8.7 7.5 8.8 9.0
No affection to the child 0.3 0.4 0.3 0.3
Others 3.0 3.1 3.0 3.0
Do not feel burdensome in particular 13.0 12.0 13.8 12.9
Notes:
1)  Calculated based on responses from the First to Third Surveys.
2)  Whether or not feeling burdensome "unknown" and caregivers "unknown" are also included in the total.

The "feeling burdens or worries about child rearing" percentage did not decrease. However, some common items between the Second and Third Surveys were dropping in general, showing changes in the nature of "burdens". Among newly added items since the Third Survey, "disobedience of the child" accounted for the highest percentage (22.0%). (Table 19)

Table 19   Changes in burdens and worries about child rearing (multiple answers)
(Unit: %)
  2nd Survey
Total Feel burdensome Do not feel burdensome in particular
  Physical burdens Financial burdens Lack of free time Lack of time with partners Unable to work enough Lack of familiar persons' understanding Being prone to illness Constant tension due to the active child Others
3rd Survey Total (100.0) (85.5) (39.4) (26.9) (64.0) (24.9) (16.1) (6.0) (6.3) (34.1) (3.9) (12.2)
100.0 100.0 100.0 100.0 100.0 100.0 100.0 100.0 100.0 100.0 100.0 100.0
Feel burdensome 86.2 90.8 94.1 94.1 92.6 93.8 92.7 96.1 93.3 93.8 90.8 54.6
  Physical burdens 32.0 35.3 54.9 40.7 37.3 41.3 38.3 50.5 41.3 43.6 35.0 9.4
Financial burdens 25.8 28.1 32.3 56.3 27.8 31.6 35.6 35.6 37.5 30.2 28.9 10.2
Lack of free time 58.6 63.9 69.1 64.1 73.0 75.8 67.5 71.4 61.4 68.6 58.7 23.0
Lack of partner's involvement in child rearing 6.2 6.7 8.1 7.9 7.1 7.2 8.7 22.6 9.0 8.2 9.2 2.8
Parental disagreement in discipline 9.5 9.9 10.5 11.0 10.0 11.0 12.8 24.0 14.0 11.7 13.7 6.5
Unable to work or do housework enough 20.1 22.2 27.3 26.2 24.1 28.0 43.3 35.9 32.2 26.1 28.7 6.0
Concerned about what people talk about the child 5.2 5.5 6.6 6.7 5.8 7.5 6.2 11.3 7.1 7.7 8.0 2.6
Constant tension due to the active child 22.8 24.9 30.6 27.4 26.2 28.9 25.7 34.5 26.3 42.1 24.8 8.4
Unable to build good relationship with other parents 1.2 1.3 1.7 1.7 1.4 1.7 1.5 3.2 1.6 1.7 2.2 0.4
No caregiver when temporary childcare is needed 12.0 13.0 14.8 15.1 13.9 16.1 14.9 23.8 14.5 15.1 17.7 5.5
Disobedience of the child 22.0 23.7 27.4 26.2 25.3 28.3 24.1 32.0 27.1 31.6 25.6 10.1
Being prone to illness 4.2 4.5 5.2 6.0 4.4 4.9 6.7 7.0 25.2 5.2 5.4 1.8
No doctor available in the neighborhood for the child taken ill suddenly 3.5 3.6 4.0 4.9 3.5 4.0 4.5 6.0 6.0 4.5 5.2 2.9
Concerned about the growth of the child 7.2 7.7 8.8 9.0 7.7 8.6 7.9 10.0 12.3 9.9 9.9 4.1
Do not know how to discipline the child 8.7 9.4 10.5 10.2 10.0 11.9 10.2 14.3 10.2 11.6 12.5 4.0
No affection to the child 0.3 0.4 0.5 0.5 0.4 0.6 0.5 1.4 0.6 0.6 1.1 0.1
Other 3.0 3.1 3.0 3.0 2.9 3.4 3.6 4.0 3.9 2.8 12.1 2.3
Do not feel burdensome in particular 13.0 8.6 5.5 5.6 6.9 5.9 6.8 3.5 6.2 5.8 8.5 43.6
Notes:
1)  Calculated based on responses from the Second and Third Surveys.
2)  Whether or not feeling burdensome "unknown" is also included in the total.
3)
(    )  means no change in the number of the burdensome.

With regards to the question about whom to ask for advice about child rearing, in comparison with the Second and Third Surveys, percentages of "friends & acquaintances" and "nursery school teachers" increased; while, those of "doctors", "PHNs (public health nurses)", etc. decreased. 1.3% of the respondents answered "nobody" to ask for advice in the Third Survey mostly because it's "not worth asking for advice". (Table 20)

Table 20   Whom to ask for advice about child rearing (multiple answers)
(Unit: %)
  1st survey 2nd survey 3rd survey
Total 100.0 100.0 100.0
Have someone to ask for advice 96.3 93.8 98.5
  Partner 82.8 79.2 82.1
The respondent's parent(s) 72.9 68.8 69.1
The partner's parent(s) 30.8 24.1 24.1
The respondent's brother(s) or sister(s) ... 25.7 25.7
The partner's brother(s) or sister(s) ... 6.1 5.9
Relatives 15.2 4.1 3.2
Friends & acquaintances 71.1 63.6 72.0
Doctors 18.0 15.1 8.2
PHNs 14.6 8.0 5.2
Midwives, nurses 5.6 1.8 1.0
Nursery school teachers 4.8 10.7 15.2
Counselors 2.9 1.8 1.3
Child rearing information site on the Internet ... ... 2.8
Mothers of kids' circles 6.2 6.4 6.1
Others 1.9 0.9 0.5
Nobody 0.8 1.1 1.3
  (Previously reported) nobody to ask for advice ... ... 0.3
(Previously reported) no intentions to ask for advice ... ... 0.2
(Previously reported) not worth asking for advice ... ... 0.8
Unknown 2.9 5.1 0.2
Notes:
1)  Calculated based on responses from the First to Third Surveys.
2)  Multiple answers in regards to whom to ask for advice


Return To Top
Index / Back / Next