(2) Playing Behaviors
About 80% of children played in children’s centers and children’s parks.
The highest proportion of the area where children “often play” was 95.1% for “home”. The next highest proportion of that was 15.1% for “public places such as children’s centers and children’s parks”. Together with 63.6% for children who “sometimes play”, children who “play” in “public places such as children’s centers and children’s parks” accounted for 78.7%.
Meanwhile, the highest proportion of the area where children do not play was 59.3% for “vacant lot and alley”, followed by 40.8% for “natural places such as open field, forest, and seashore” (Table 3).
About 90% of children play with “children of the same age” or “adults (parents, grandparents, etc.)”.
“Sibling(s)” accounted for the highest proportion of 73.1% among playmates that children “often play” with. Following this, children who “often play” with “children of the same age” accounted for 50.8% and those who “often play” with “adults (parents, grandparents, etc.)” 50.5%. Children who “play” with “children of the same age” accounted for 88.9% and those who “play” with “adults (parents, grandparents, etc.)” 93.1%, together with the proportion of children “sometimes play” with “children of the same age” and “adults (parents, grandparents, etc.)” (Table 3).
Table 3 Play areas and playmates
| ||||||||||||||||||||||||||||||||||||||||||||||||||||||||||||||||||||||||||||||||||||||||||||||||||
Over 30% of parents worry about “having no friend in the neighborhood”.
The highest proportion of worry about play areas (multiple answers) was “having no place to play on rainy days (except for home)”, accounting for 51.0% (Table 4).
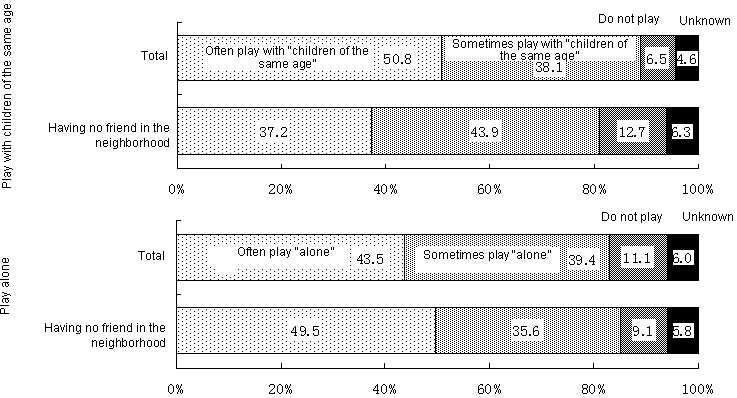
The highest proportion of worry about the relationship with friends (multiple answers) was “having no friend in the neighborhood”, accounting for 34.4%. Comparing playmates of children with worry “having no friend in the neighborhood” to the total, the proportion of children who “often play” with “children of the same age” was low (37.2%), and that of those who “often play” “alone” was high (49.5%) (Table 5 and Figure 6).
|
Table 4 Worry about play areas
|
Table 5 Worry about the relationship
|
Figure 6 Playmates of children with worry “having no friend in the neighborhood”

| ||||||||