| HOME | 統計情報 | 前ページ | 次ページ |
表7-1 離婚率(人口千対)の高率県と低率県の年次比較 −昭和25・50・平成10年−
Table 7-1 Yearly comparison of prefectures with high divorce rates, and of those with low divorce rates ( per 1,000 population) ,1950,'75,'98
| 昭和25年 (1950) |
昭和50年 (1975) |
平成10年 (1998) |
|||||||
| 都道府県 Prefecture |
離婚率 Divorce rates |
都道府県 Prefecture |
離婚率 Divorce rates |
都道府県 Prefecture |
離婚率 Divorce rates |
||||
| 全国 Total |
1.01 | 1.07 | 1.94 | ||||||
| 離婚率の 高率県 Prefectures with high divorce rates |
39 | 高知 | 1.29 | 01 | 北海道 | 1.65 | 47 | 沖縄 | 2.72 |
| 42 | 長崎 | 1.28 | 39 | 高知 | 1.45 | 27 | 大阪 | 2.42 | |
| 38 | 愛媛 | 1.25 | 02 | 青森 | 1.40 | 01 | 北海道 | 2.38 | |
| 40 | 福岡 | 1.25 | 40 | 福岡 | 1.33 | 40 | 福岡 | 2.23 | |
| 05 | 秋田 | 1.24 | 47 | 沖縄 | 1.29 | 13 | 東京 | 2.21 | |
| 離婚率の 低率県 Prefectures with low divorce rates |
08 | 茨城 | 0.64 | 25 | 滋賀 | 0.63 | 32 | 島根 | 1.27 |
| 20 | 長野 | 0.67 | 32 | 島根 | 0.65 | 15 | 新潟 | 1.34 | |
| 25 | 滋賀 | 0.69 | 15 | 新潟 | 0.70 | 06 | 山形 | 1.38 | |
| 19 | 山梨 | 0.70 | 06 | 山形 | 0.71 | 16 | 富山 | 1.38 | |
| 11 | 埼玉 | 0.74 | 20 | 長野 | 0.71 | 18 | 福井 | 1.45 | |
| 注: | 1)離婚率が同率の場合は少数第3〜4位を算出することによって順位を付けた。 |
| 2)昭和25年は沖縄を含まない。 |
| Notes: | 1) When two or more prefectures have the same percent distribution,calculation is made to the third to fourth decimal place in order to decide ranking. |
| 2) Okinawa Prefecture is excluded in 1950. |
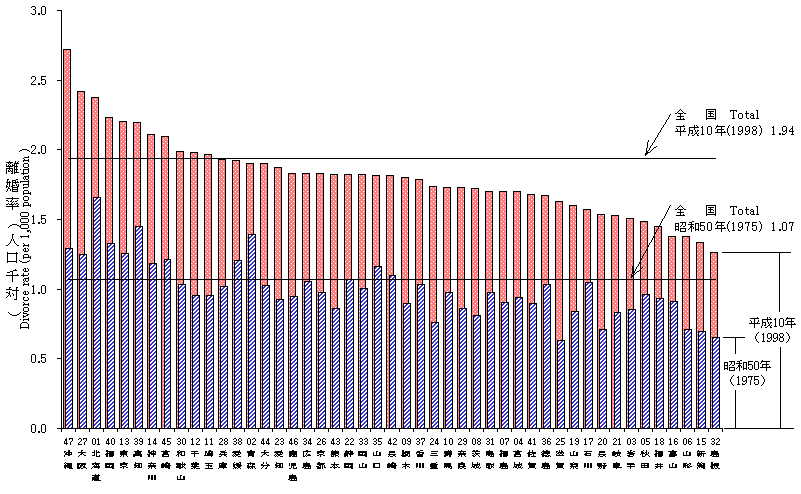
図7-1 都道府県別にみた離婚率(人口千対)の年次比較 −昭和50・平成10年−
Figure 7-1. Yearly comparison of divorce rates by each prefecture ( per 1,000 population) ,1975,'98

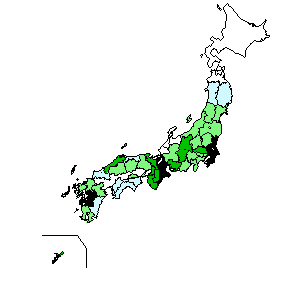
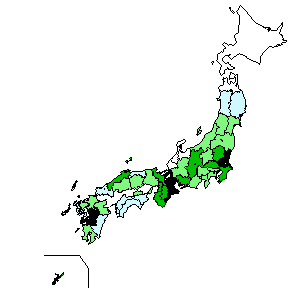
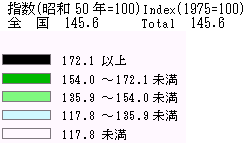
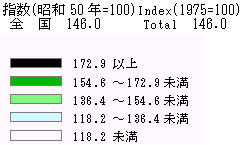
図7-2 都道府県別にみた有配偶離婚率(有配偶人口千対)指数 −平成7年−
Figure 7-2 Divorce rate indices of married population by each prefecture (per 1,000 married population) ,1995
| 有配偶離婚率(男子有配偶人口千対) Divorce rates for married population (per 1,000 married male population) |
有配偶離婚率(女子有配偶人口千対) Divorce rates for married population (per 1,000 married female population) |
|
|
|
|
| HOME | 統計情報 | 前ページ | 次ページ |