5. RISK ASSESSMENT
5.1 Overall Approach and Measures of Risk
The risk to the population of Ireland from any infectivity present in dorsal root ganglia has been evaluated by combining the data and assumptions presented in the previous sections in a simple “event tree”.
The risk is presented in terms of the expected consumption of infectivity in terms of human oral ID50 units. A worst case assumption would be that exposure to one human oral ID50 unit would result in a 50% chance of infection and similarly exposure to 0.1 of an ID50 would result in a risk of infection of 5%. This is based on the underlying assumption that there is a linear dose response relationship and that there is no safe threshold. This is likely to be very pessimistic, especially for very low exposures.
Two measures are used. The first is the overall societal risk. This is determined from the total number of infectious units consumed by the entire population of Ireland within the year 2000. The second measure is the individual risk, which is represented as the expected consumption per year by any one individual of human oral ID50 units. A likely maximum value of individual risk has been assessed for the 2% of the population estimated to eat T-bone steak once a week. An average value of the individual risk has been estimated for the 67% of the population that eats beef weekly.
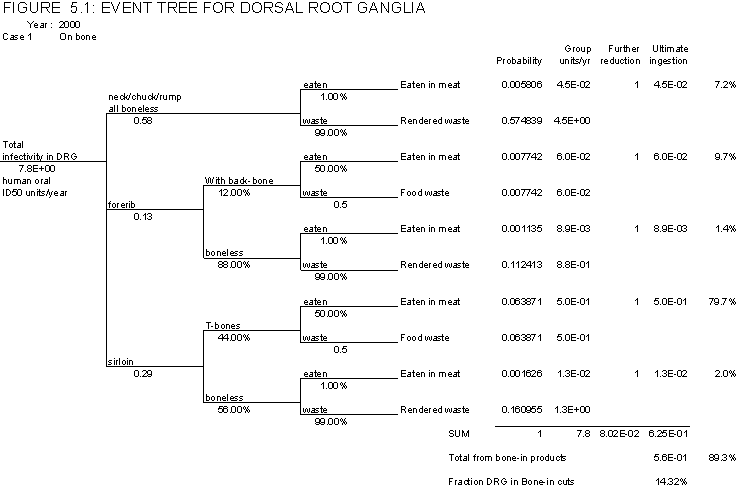
The event tree for assessing exposure to infectivity in DRG is shown as Figure 5.1. The starting point for the event tree is the total infectivity present in the DRG of all cattle slaughtered for domestic consumption in Ireland in 2000. This is estimated to have a median value of 8 human oral ID50 units, but with a 95 percentile range of .05 to 1400. This is calculated from the estimate of the number of animals with significant infectivity slaughtered for domestic consumption in 2000, as shown in Table 3.2, multiplied by amount of DRG present and the infectivity density in CNS tissue (section 4.3). The median value is shown on the event tree in Figure 5.1.
The first branch of the event tree reflects the cuts of meat along the vertebral column as discussed in Section 2.2. The probabilities simply reflect the fraction of DRG in that section of the carcase. Thus 4 out of 31 DRG (13%) are found in the fore rib section. The next branch considers the fraction of the fore rib or sirloin section that is sold as rib with vertebral column or T-bone steak respectively. The probabilities are based on the results of the survey of abattoirs reported in Section 2.3.
The final branch considers the fraction of the DRG that is eaten. For boneless cuts this is the fraction removed from the bone by the butcher, and for the bone-in cuts it is the fraction assumed to be consumed. Both these were discussed in Section 2.4.
On the right side of the event tree are 4 columns which summarise how the results are calculated. The first column gives the total probability for that pathway; it is the product of all the branch probabilities along that pathway. The second column gives the total number of infective units from that pathway and is the product of the probability in Column 1 with the total input infectivity. The third column is the infectivity ingested. These are the same values as in column 2 but only present if that infectivity is ingested by people. The final column gives the percentage of the total infectivity ingested for that pathway.
Note that the values given in Figure 5.1 are single point values and will be different to the results from the simulation as presented below. They are included to illustrate how the event tree is quantified.
The event tree has been evaluated using a probabilistic risk assessment approach to reflect the uncertainties in the input parameters. Each variable has been defined as a distribution of values and the result calculated many times using a Monte Carlo simulation tool (Crystal Ball, Decisioneering Inc). The values used for the input data are presented in Appendix 1. The simulation has been carried out using Latin Hypercube sampling with 10,000 iterations.
The results have been evaluated for two main cases, representing alternative assumptions for the amount of DRG that would be cut away from the bone with the meat when it is deboned. Both cases are assessed for meat being sold on the bone and for all meat being removed from the bone. In addition, for Case 1, two further cases are included to test the sensitivity to the range of values used for the DRG consumed from bone-in cuts. The results for the assessment are presented in Table 5.1, which gives the median values of the Societal Risk, the Maximum Individual Risk and the Average Individual Risk for each of the cases and Table 5.2, which in addition gives the 95 percentile ranges for the distribution of results.
In Case 1 it is assumed that 1% of the DRG are cut away with the meat when bone is removed from the meat in the butcher shop, and so would be consumed with the meat. Case 1.1 is with meat sold on the bone and Case 1.2 with all meat sold off the bone. Where meat is sold on the bone, the amount of DRG consumed is assumed to be a range of values from 5 to 95% as explained in Section 2.4. The sensitivity to this range is tested with two additional cases, Case 1.3, where the amount of DRG consumed from bone in cuts is set at 5%, and Case 1.4 where it is set at 95%.
| Case | DRG in meat from deboning | DRG consumed from bone-in cuts | Meat sold on the bone? | Societal Risk Total ID50 units in 2000 |
Average Individual Risk ID50 units per person/yr |
Max Individual Risk ID50 units per person/yr |
% due to bone-in |
| Median | Median | Median | |||||
| 1.1 | 1% | 5- 95% |
Yes | 0.6 | 2.10-7 | 7.10-6 | 89% |
| 1.2 | 1% | n/a | No | 0.08 | 3.10-8 | n/a | 0% |
| 1.3 | 1% | 5% | Yes | 0.1 | 5.10-8 | 1.10-6 | 46% |
| 1.4 | 1% | 95% | Yes | 1 | 4.10-7 | 1.10-5 | 94% |
| 2.1 | 0.1% | 5- 95% |
Yes | 0.5 | 2.10-7 | 6.10-6 | 99% |
| 2.2 | 0.1% | n/a | No | 0.008 | 3.10-9 | n/a | 0% |
For Case 1.1, the median value of the total infectivity ingested by the population of Ireland due to infectivity in dorsal root ganglia is estimated to be 0.6 human oral ID50 units, with a 95 percentile range from 0.003 to 110. This means that the model estimates that 0.6 human oral ID50 units of infectivity would have been consumed by the entire beef eating population of Ireland in 2000. This is about 7% of the total infectivity present in all DRG. About 90% of the infectivity consumed is estimated to be from bone-in cuts with these assumptions.
This risk is spread over a large number of people, and the average individual risk for those that eat beef regularly (67% of the population eat beef weekly according to the beef consumption survey; see section 2.3) is estimated to be 2 x 10⁻⁷ human oral ID50 units per person per year, with a 95 percentile range of 1 x 10⁻⁹ to 4 x 10⁻⁵. The maximum individual risk for those eating T-bone steaks frequently (once a week) is estimated to be 7 x 10⁻⁶ human oral ID50 units per person per year, with a 95 percentile range of 4 x 10⁻⁸ to 1 x 10⁻³.
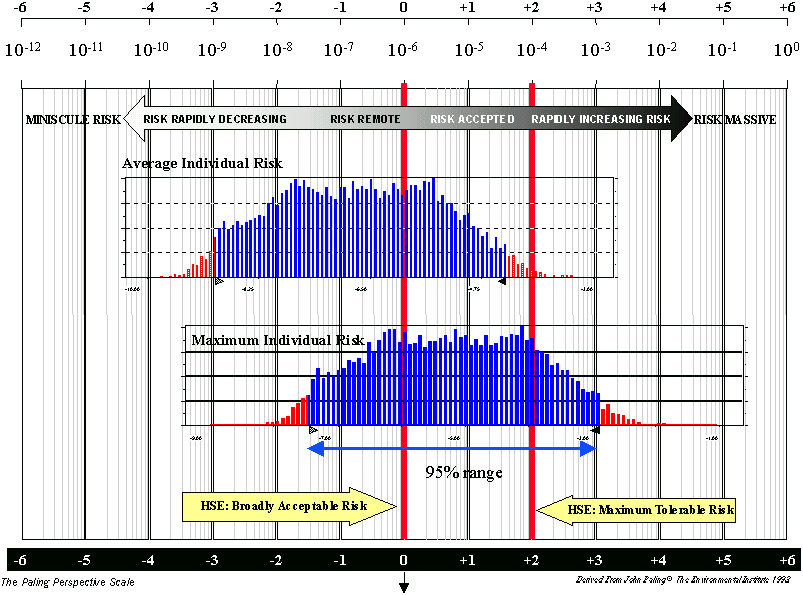
The median value for the average individual risk is within the level of what would normally be considered acceptable. However, the range of values extend towards the top end of the range that may be considered tolerable. This is illustrated in Figure 5.2, which shows the distribution of values for the average individual risk on a logarithmic “Risk Perspective” scale.
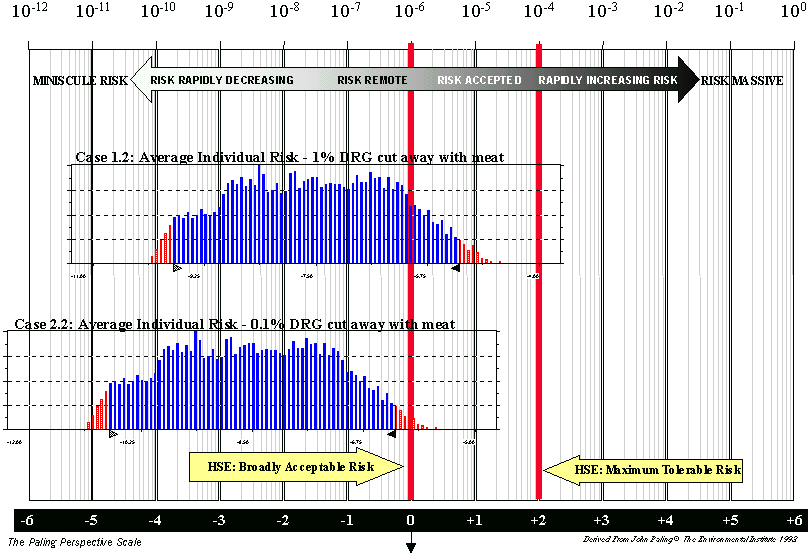
Case 1.2 keeps the same assumptions as for Case 1.1, except that no meat is sold on the bone. The median value of the total infectivity ingested is now estimated to be 0.08 human oral ID50 units, and the median value of the average individual risk is reduced to 3 x 10⁻⁸ human oral ID50 units. The model predicts that banning the sale of beef on the bone reduces the societal and average individual risk by a little less than one order of magnitude.
| a) | Case 1.1: Average and Maximum Individual Risk |
| b) | Cases 1.2 & 2.2: All Meat Sold Off Bone |
| Case | DRG in meat from deboning | DRG consumed from bone-in cuts | Meat sold on the bone? | Societal Risk Total ID50 units in 2000 |
Average Individual Risk ID50 units per person/yr |
Maximum Individual Risk ID50 units per person/yr |
||||||
| Median | 95% range | Median | 95% range | Median | 95% range | |||||||
| 1.1 | 1% | 5-95% | Yes | 0.6 | 3.10-3 | 110 | 2.10-7 | 1.10-9 | 4.10-5 | 7.10-6 | 4.10-8 | 1.10-3 |
| 1.2 | 1% | n/a | No | .08 | 5.10-4 | 14 | 3.10-8 | 3.10-10 | 5.10-6 | n/a | ||
| 2.1 | 0.1% | 5-95% | Yes | 0.5 | 3.10-3 | 100 | 2.10-7 | 1.10-9 | 4.10-5 | 6.10-6 | 3.10-8 | 1.10-3 |
| 2.2 | 0.1% | n/a | No | .008 | 5.10-5 | 1 | 3.10-9 | 2.10-11 | 5.10-7 | n/a | ||
The maximum individual risk is reduced by just over two orders of magnitude as there is no longer a relatively small group of more highly exposed individuals (those eating T-bones once a week).
In Section 3 it was reported that the UCC model of BSE epidemic in Ireland predicted that there were no animals slaughtered in the calendar year before clinical onset of BSE at less than 3 years of age. This would suggest that there is no risk associated with animals slaughtered when less than 3 years old, which represent 95% of the animals used for domestic consumption. However, in the probabilistic assessment it is assumed that there is a low probability of some animals being slaughtered in the calendar year before clinical onset. This results in 93% of the overall risk being due to animals slaughtered at more than 3 years old. Thus over 90% of the risk reduction could be achieved by banning the sale of beef on the bone only from cattle slaughtered at over 3 years of age, rather than from all cattle.
It is less likely that meat from the older animals would be used for cuts such as rib of beef and T-bone steaks, but there were no data to confirm this, and this has not been allowed for in the assessment. If this was confirmed it would reduce the risk levels.
Cases 1.3 and 1.4 have been included to examine the sensitivity to the assumption on the fraction of DRG present in bone-in cuts that would be consumed. For Case 1.1 this was taken as a normal distribution with a 95 percentile range from 5% to 95% as given in Section 2.4. In these cases single values at the extremes of this distribution are used for the fraction of DRG consumed, 5% for Case 1.3 and 95% for case 1.4. The results show that the Societal risk value is 0.1 for Case 1.3 and 1 for case 1.4 as compared with a value of 0.6 for Case 1.1. Thus this range of values for the fraction of DRG consumed from bone-in cuts results in a range of almost one order of magnitude. This compares with a 95 percentile range of about 4 orders of magnitude (3.10-3 to 110) for Case 1.1. Thus the uncertainty in the fraction of DRG consumed is relatively small compared to the uncertainties in the infectivity.
In Section 2.4 it was reported that a brief study had indicated that 0.4% of the DRG would be removed from the bone with the meat during normal deboning procedures, but that a conservative value of 1% would be used in the study. That was the value used in Case 1. In Case 2 the sensitivity to this assumption is tested by assuming that only 0.1% of the DRG are removed with the meat.
In Tables 5.1 and 5.2 it can be seen that the results for Case 2.1, with the meat sold on the bone, are very similar to those of Case 1.1. Thus with meat sold on the bone the choice of value for the fraction of DRG removed with the meat makes little difference. This is because 90% or more of the risk arises from the bone-in cuts. However, a comparison of Case 2.2 with Case 1.2 shows that when beef is not sold on the bone this change in assumption reduces the risk by one order of magnitude. This also means that there is a bigger risk reduction from stopping the sale of beef on the bone. It is likely that the real position lies between Cases 1 & 2.
5.4.3 Exposure from an infected animal
In Section 3.3 it was reported that an average of 0.9 infected animals (all over 3 years of age) would have been slaughtered for domestic consumption in 2000. It is therefore likely that at least one infected animal would have entered the domestic food chain. An alternative approach to assessing the risk is to consider the exposure to infectivity to someone eating beef products from that animal.
The average weight of a DRG has been taken to be 0.5 grams. The model predicts that the median value of the infectivity present in any one DRG from an infected animal would be 0.1 human oral ID50 units, with a 95 percentile range from zero to 22. The detailed results show that 72% of all DRG would have less than 1 human oral ID50 units,. As only half of the T-bones cut from any one carcase would have DRGs present, there is therefore about a 14% risk of being exposed to more than 1 human oral ID50 unit of infectivity from eating one T-bone steak from an animal with significant levels of BSE infectivity.
The chance that any one animal has a significant level of infectivity is simply the expected number of infected animals (0.9) divided by the total number slaughtered for domestic consumption (205,700), giving a probability of 4 x 10⁻⁶. The chance that any one T-bone steak contained more than one human oral ID50 unit of infectivity is estimated to be 7 x 10⁻⁷ (about one in a million). This is slightly greater than the median value of the average individual risk presented in Section 5.4.1. For someone who eats 50 T-bone steaks a year the risk would be about 3 x 10⁻⁵; this latter is about 4 times greater than the maximum individual risk for Case 1.1.