Index / Back / Next

4. Implementation of the long-term care insurance system

 With the efforts made by people involved (municipalities, service facilities, etc.), the system is generally been implemented smoothly without any big confusion, and there are good effects such as the increase in the number of service supply.
 Also, from October 2000, the reception of insurance premiums by elderly persons has begun. This system is going well without any big confusion with efforts made by municipalities.

(1) In-home service use

  1. Comparison of service usage before and after the implementation of the long-term care insurance.

      Monthly average in 1999 *1 November 2000 *2 May, 2001 *2
    Home-visit long-term care 3,550,000 5,390,000(52% over) 6,450,000(82% over)
    Commuting long-term care 2,500,000 3,400,000(36% over) 3,840,000(54% over)
    Short stay 918,000 days 849,000 days(7% decrease) *3 1,092,000 days(19% over) *3
    Group home for the elderly with dementia 266 place(Number of operating cost subsidies in 1999) 870 place(March, 2001) 1,312 place(September, 2000)
    *1The figures for home-visit long-term care, commuting long-term care and short stay are taken from autonomy data which is used as the basis for the FY 2000 Map of health and social welfare for the elderly.
    *2Sum of past benefit payments by federations of National Health Insurance Association.
    *3Past benefit payments by federations of National Health Insurance Association do no include service use replacement (measurement to replace the remainder of home-visit commuting service benefits to short stay services). Therefore, the data above has been calculated from the results of surveys conducted by 108 insurers.

  2. Change in the individual's amount of service use

    Persons whose use of service increased Persons whose use of service is about the same as before Persons whose use of service decreased
    67.5% 14.8% 17.7%
    Note: The change in the amount of service use in March 2000 and July 2000 by 1,263 persons living in definite municipalities (108 Insurers).

     Among these people (1,263 people), only 32 people (2.5%) replied that they 'decreased the amount of service because the users' cost sharing is too high'. Nearly 70% of past service users increased their use of service with the implementation of the long-term care insurance system.

  3. Increase in service users

     According to a survey conducted by autonomies, new users of service increased from 30% to 50% with the implementation of the long-term care insurance system

    Local Government Ishikawa-cho, Fukushima prefecture Yokohama-city Nagoya-city Tottori prefecture Tsuyama-city, Okayama prefecture
    Rate of increase 48.2% 30.9% 29.5% 47.1% 49.2%
    (In the Ministry of Health, Labour and Welfare survey conducted in April 2000 (96 municipalities), new service users increased by approximately 23%)

  4. Rate of in-home services usage (Usage rate in comparison with limit for benefits paid)

    Support required Care level 1 Care level 2 Care level 3 Care level 4 Care level 5 Average
    54.2% 37.5% 42.6% 43.7% 43.9% 44.6% 43.2%
    Note: Survey of 8,323 people in definite municipalities (106 insurers) (Care plan random sampling method. In principle, survey on services provided in July 2000)

    (a)With the basic concept to put emphasis on long-term care at home, limit for benefits will be set at a level much higher than the present service standard.
    (b)The actual ratio of usage will be determined by the person's needs and amount of service supply. With the fixation of the system and increase in service supplies, it is estimated to increase in the future.
    (c)In-home service usage rate in comparison with the limit for benefits is estimated to be approximately 33% in the FY2000 budget. This includes persons who do not use the service at all. 43.2% in the above table is the percentage of those who use the service. Therefore, the rate of in-home service usage is estimated to be around the same as before.

(2) Situation of long-term care service facilities

  1. In-home service enterprises entering the market are increasing since April, and the total number of service facilities nationwide is increasing as well.
    Some private enterprises are reducing service bases, but enterprises which have adhered closely to the region and established reliance with users are doing steady business.

      April, 2000 April, 2002
    Home-visit long-term care 9,185 15,008(63% increased)
    Residence long-term care assistance 19,466 23,321 (19% increased)

  2. As for services at facilities, there are approximately 119,000 beds in sanatorium type medical care facilities for the elderly requiring care (sanatorium-type wards, etc.). This is less than the estimate made by municipality long-term care insurance service plans (approximately 179,000 beds).

(3) The state of long-term benefit payment (Provisional sum)

(Unit: 100 million)
Month service was provided APR. JUL. OCT. JAN. APR. JUL. OCT. JAN. Mar.
In-home service 600 1,000 1,060 1,000 1,130 1,270 1,360 1,310 1,440
Service at facilities 1,540 1,970 2,040 2,030 2,000 2,130 2,130 2,140 2,170
Total 2,140 2,970 3,100 3,030 3,130 3,400 3,490 3,450 3,610
(2,170) (2,910) (3,040) (2,970) (3,170) (3,340) (3,320) (3,380) (3,540)
Notes 1:Total of long-term care benefits except the 10% users' charge (90% charge) paid by federations of National Health Insurance Associations in the past.
2:Excludes charges municipalities pay directly, such as purchase allowance for welfare equipments and allowance for modifying house.
3:The brackets in the Total column are the figures adjusted for each month (30.4 days).

(4) State of implementation at municipalities

 1)Number of insured persons, etc. (end of Mar. 2002)
Number of Category 1 insured persons (aged 65 or over)23,170,000 persons
Number of certified persons requiring long-term care or support2,980,000 persons

 2)Number of service users
Number of residence long-term care(support) service recipients1,620,000 persons
Number of long-term care service recipients at facilities670,000 persons
*Reported in Mar. 2002 (service provided in Jan. 2002)

 3)Premiums

(a)The receipt of category 1 insurance premiums are going well.
Reception rate 98.6% (reception rate of premium for FY 2000 in all municipalities)
Reception rate 98.9% (reception rate of premium for Oct.2001 in 88 municipalities)

(b)Some municipalities reduct or exempt the premiums for people with low income.
  Number of municipalities enforcing reduction and exemption by themselves. Number of municipalities obeying the Three Principles
Oct. 1, 2000 72 4
Apr. 1, 2001 139 43
Oct. 1, 2001 309 191
Apr. 1,2002 431 314
※(1)Total exemption of insurance premiums
(2)Uniform reduction and exemption with regards to income only. (No account taken into their property, etc.)
(3)Covering the cost of reduction and exemption of insurance premiums by the general revenue is not appropriate since it is against the purpose of the system.

 4)Situation of user fee reduction measures (April 1, 2002)

Total of 3,241 municipalities nationwide
Reduction measures for home helper users as a temporary measurement3,213(99.1%)
Reduction measures by social welfare foundations2,369(73.1%)
  Expanded eligible persons (Note)763(23.5%)
Reduction and exemption by municipalities825(25.5%)
(Ref.)The number of reduction measures taken by social welfare foundations as of April 1, 2000 is 1,796. (55.3%)
Note:At the end of 2000, eligible persons for this measurement was expanded from 2% to 10% for Category 1 insured persons.

 5)Situation of long-term care protection and living support services enforced (April 1, 2002)

Total of 3,241 municipalities nationwide
Food delivery service2,514(77.6%)
Support to go outside1,813(55.9%)
Light daily life assistance service2,270(70.0%)
Commuting services to support activities for fulfilling life2,807(86.6%)

(5) Long-term care insurance viewed from questionnaires

 1)Satisfaction of users' service

(Summary of answers from 11,181 people living in Aomori Prefecture, Toyama Prefecture, Ishikawa Prefecture, Hiroshima Prefecture, Shimane Prefecture, Kochi Prefecture, Kumamoto Prefecture, Chiba City and Wakayama City)

  • Approximately 86% of users replied that they are 'satisfied' or 'nearly satisfied' with the service they are using.
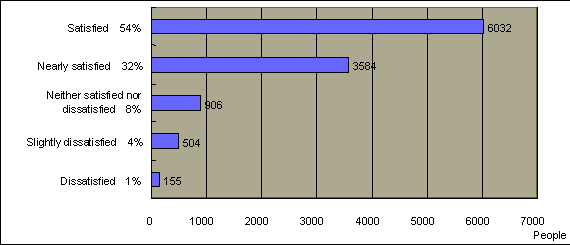
figure

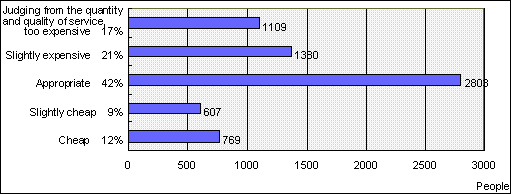
 2)Emotional burden of usage fee

(Summary of answers from 6,668 people living in Fukushima Prefecture, Hiroshima Prefecture, Kochi Prefecture, and Kobe City)

  • Approximately 42% of users replied that the service fee is appropriate judging from the quality and quantity of service.

figure

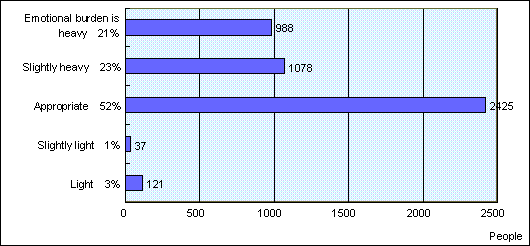
 3)Emotional burden of insurance premiums

(Summary of answers from 4,649 people living in Miyagi Prefecture, Fukushima Prefecture, Chiba City and Wakayama City)

  • Approximately 52% of insured persons replied that the insurance premium is appropriate

figure

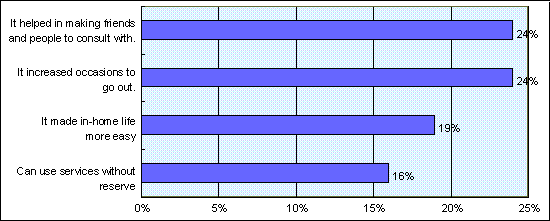
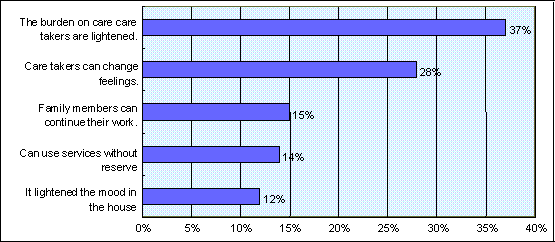
 4)Effects of the system

  • As for the effects of the system, many replied that 'the family's burden lightened', 'it encouraged everyday life', and 'in-home life became possible'.

    Replies of insured persons living in Miyagi Prefecture

figure

Replies of care takers (family) living in Miyagi Prefecture

figure


Return To Top
Index / Back / Next