(6) Divorces
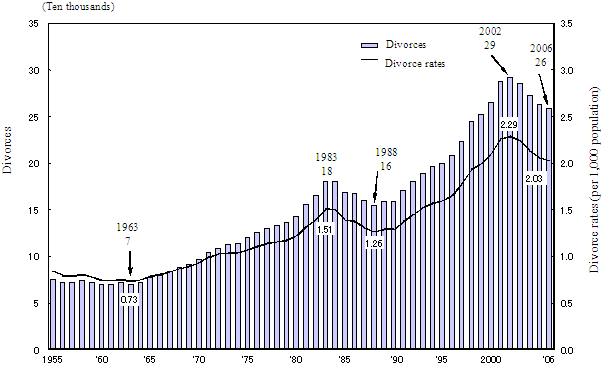
Regarding trends in divorces and divorce rates, divorces fluctuated around 70 thousands, and divorce rates between 0.7 and 0.8 during 1955-1964. After 1964, they gradually increased and reached 180,000 and 1.51, respectively, in 1983. After a period of decrease to 1988, they began to increase once again, but have demonstrated a downward trend in recent years. Values in 2006 were at 260,000 and 2.03, respectively (Figure 11).
Figure 11. Trends in divorces and divorce rates, 1955-2006

Observing the combined nationalities of wife and husband, according to the nationality of the wife, the percentages of Japanese husband were particularly high, excluding Peru (Table 7).
Table 7. Divorces and percent distribution by nationality of wife and husband, 2006
| Nationality of wife |
Nationality of husband | |||||||||||
| Total | Japan | Foreign countries | ||||||||||
| Total | Korea | China | Philippines | Thailand | U.S.A. | United Kingdom |
Brazil | Peru | Other foreign countries |
|||
| Divorces (couples) | ||||||||||||
| Total | 258 778 | 254 086 | 4 692 | 1 390 | 1 027 | 112 | 44 | 407 | 84 | 150 | 113 | 1 365 |
| Japan | 243 762 | 240 373 | 3 389 | 927 | 499 | 105 | 39 | 393 | 84 | 98 | 73 | 1 171 |
| Foreign countries | 15 016 | 13 713 | 1 303 | 463 | 528 | 7 | 5 | 14 | - | 52 | 40 | 194 |
| Korea | 3 154 | 2 718 | 436 | 418 | 4 | - | - | 3 | - | 1 | - | 10 |
| China | 5 280 | 4 728 | 552 | 21 | 521 | 1 | - | 2 | - | 2 | 3 | 2 |
| Philippines | 4 100 | 4 065 | 35 | 11 | 1 | 5 | 1 | 4 | - | 6 | 3 | 4 |
| Thailand | 885 | 867 | 18 | 3 | - | - | 2 | 1 | - | 7 | - | 5 |
| U.S.A. | 65 | 60 | 5 | - | - | - | 1 | 1 | - | 1 | - | 2 |
| United Kingdom |
27 | 27 | - | - | - | - | - | - | - | - | - | - |
| Brazil | 119 | 90 | 29 | - | - | - | - | 1 | - | 19 | 2 | 7 |
| Peru | 100 | 59 | 41 | - | - | - | - | - | - | 11 | 22 | 8 |
| Other foreign countries |
1 286 | 1 099 | 187 | 10 | 2 | 1 | 1 | 2 | - | 5 | 10 | 156 |
| Percent distribution of husband’s nationality by nationality of wife (%) | ||||||||||||
| Total | 100.0 | 98.2 | 1.8 | 0.5 | 0.4 | 0.0 | 0.0 | 0.2 | 0.0 | 0.1 | 0.0 | 0.5 |
| Japan | 100.0 | 98.6 | 1.4 | 0.4 | 0.2 | 0.0 | 0.0 | 0.2 | 0.0 | 0.0 | 0.0 | 0.5 |
| Foreign countries | 100.0 | 91.3 | 8.7 | 3.1 | 3.5 | 0.0 | 0.0 | 0.1 | - | 0.3 | 0.3 | 1.3 |
| Korea | 100.0 | 86.2 | 13.8 | 13.3 | 0.1 | - | - | 0.1 | - | 0.0 | - | 0.3 |
| China | 100.0 | 89.5 | 10.5 | 0.4 | 9.9 | 0.0 | - | 0.0 | - | 0.0 | 0.1 | 0.0 |
| Philippines | 100.0 | 99.1 | 0.9 | 0.3 | 0.0 | 0.1 | 0.0 | 0.1 | - | 0.1 | 0.1 | 0.1 |
| Thailand | 100.0 | 98.0 | 2.0 | 0.3 | - | - | 0.2 | 0.1 | - | 0.8 | - | 0.6 |
| U.S.A. | 100.0 | 92.3 | 7.7 | - | - | - | 1.5 | 1.5 | - | 1.5 | - | 3.1 |
| UK | 100.0 | 100.0 | - | - | - | - | - | - | - | - | - | - |
| Brazil | 100.0 | 75.6 | 24.4 | - | - | - | - | 0.8 | - | 16.0 | 1.7 | 5.9 |
| Peru | 100.0 | 59.0 | 41.0 | - | - | - | - | - | - | 11.0 | 22.0 | 8.0 |
| Other foreign countries |
100.0 | 85.5 | 14.5 | 0.8 | 0.2 | 0.1 | 0.1 | 0.2 | - | 0.4 | 0.8 | 12.1 |
