(2) General mortality
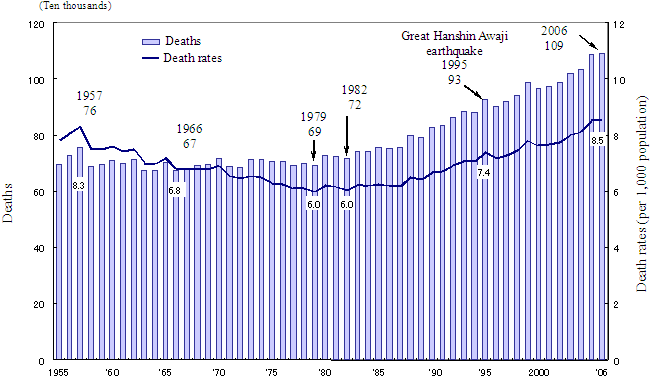
Regarding trends in deaths and death rates, the number of deaths fluctuated around 700,000 until around 1980 and death rates had gradually declined since 1957, recording the lowest rate of 6.0 in 1979 and 1982. Since this time, deaths have demonstrated an upward trend, and death rates have been growing, reflecting the aging of the population (Figure 3, Table 5).
Figure 3. Trends in deaths and death rates, 1955-2006

Table 5. Trends in deaths and death rates by sex, 1955-2006
| Year | Deaths (persons) | Death rates (per 1,000 population) |
||
| Total | Male | Female | ||
| 1955 | 697 398 | 367 936 | 329 462 | 7.8 |
| 1960 | 710 737 | 380 535 | 330 202 | 7.6 |
| 1965 | 704 100 | 381 359 | 322 741 | 7.2 |
| 1970 | 716 643 | 390 570 | 326 073 | 6.9 |
| 1975 | 705 874 | 380 355 | 325 519 | 6.3 |
| 1980 | 726 632 | 393 330 | 333 302 | 6.2 |
| 1985 | 756 440 | 410 515 | 345 925 | 6.2 |
| 1990 | 824 866 | 446 679 | 378 187 | 6.7 |
| 1995 | 927 709 | 504 803 | 422 906 | 7.4 |
| 2000 | 967 195 | 529 314 | 437 881 | 7.6 |
| 2001 | 976 008 | 532 305 | 443 703 | 7.7 |
| 2002 | 988 086 | 538 815 | 449 271 | 7.8 |
| 2003 | 1 020 723 | 555 241 | 465 482 | 8.0 |
| 2004 | 1 034 353 | 560 565 | 473 788 | 8.1 |
| 2005 | 1 089 843 | 588 533 | 501 310 | 8.5 |
| 2006 | 1 090 419 | 584 901 | 505 518 | 8.5 |
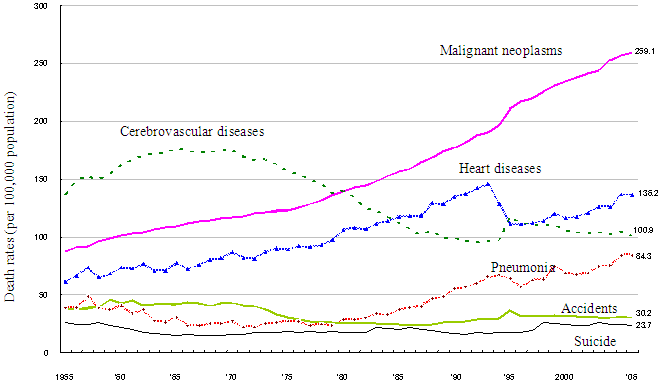
Observing death rates by causes of deaths, cerebrovascular diseases, malignant neoplasms, and heart diseases were high, in descending order, in 1955-1964. Since this time, the number of deaths due to cerebrovascular diseases have decreased, while those due to malignant neoplasms, heart diseases, and cerebrovascular diseases have increased, in descending order, since 1997 (Figure 4).
Figure 4. Trends in death rates by causes of deaths, 1955-2006

Note: The declining of heart diseases in 1994-1995 was believed to be due to the effect of revision of death certificates. |
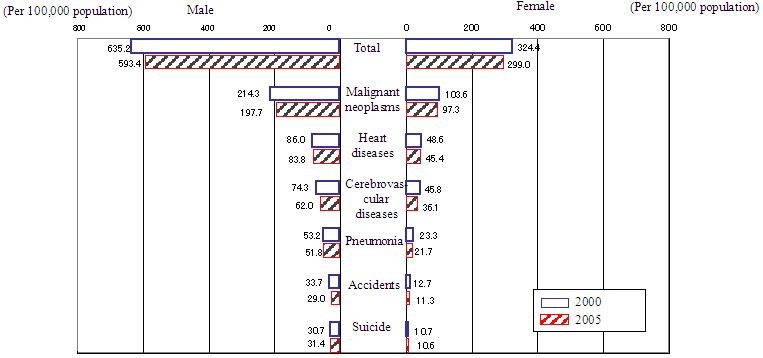
In terms of age-adjusted death rates by sex, figures for males were high, nearly doubling those for females in most causes of death. Comparing the age-adjusted death rates in 2000 with those in 2005, the figures for both males and females declined in most of causes of death (Figure 5).
Figure 5. Yearly comparison of age-adjusted death rates by causes of death,
2000 and 2005

Note: Age-adjusted death rates are indices calculated by applying death rates by age group to a certain standard population (model population in 1985) to compare death rates among groups having different population composition. |
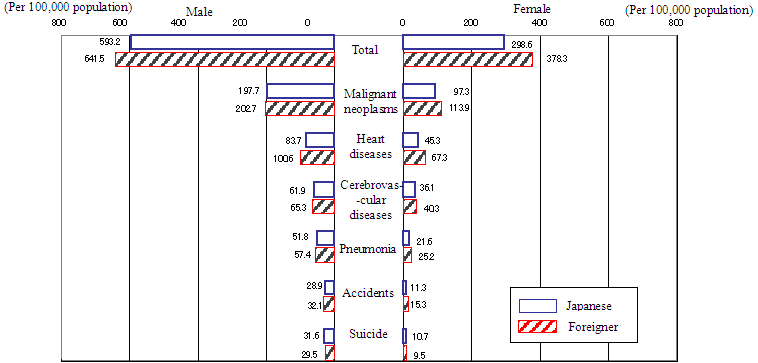
Comparing the age-adjusted death rates in 2005 between Japanese and foreigners, figures for both male and female foreigners were higher for the total and causes of death, except for suicide (Figure 6).
Figure 6. Comparison of age-adjusted death rates by causes of death according to
nationality (Japanese and foreign), 2005

Note: Age-adjusted death rates are indices calculated by applying death rates by age group to a certain standard population (model population in 1985) to compare death rates among groups having different population composition. |
