
Summary of Results
(1) Natality
With regard to trends in live births and live birth rates, live births have been decreasing after the peak of 2.11 million persons in 1973 during the second baby boom. They reached 1.1 million persons in 2006, decreased by about 1 million persons during 33 years.
Live birth rates have been on a downward trend after they showed 19.4 in 1973 during the second baby boom. However, in 2006, they exceeded the figure in the previous year, showing 8.6 (Figure 1, Table 1).
Figure 1. Trends in live births and live birth rates, 1955-2006
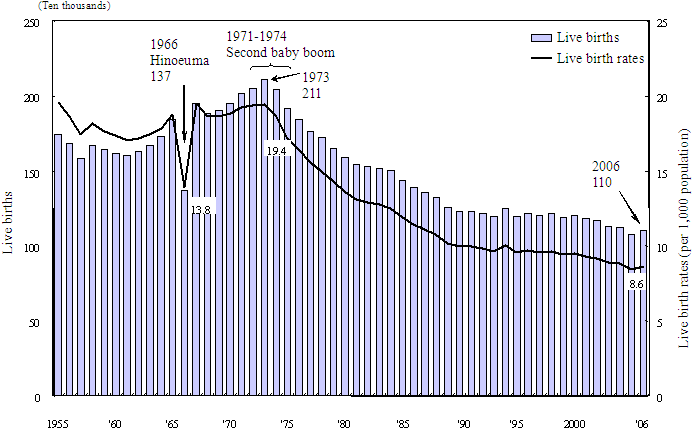
Table 1. Trends in live births by sex and live birth rates, 1955-2006
| Year | Live births (persons) | Live births rates (per 1,000 population) |
||
| Total | Male | Female | ||
| 1955 | 1 746 299 | 897 797 | 848 502 | 19.6 |
| 1960 | 1 619 175 | 831 572 | 787 603 | 17.3 |
| 1965 | 1 837 476 | 942 493 | 894 983 | 18.7 |
| 1970 | 1 947 944 | 1 007 462 | 940 482 | 18.8 |
| 1975 | 1 914 707 | 985 995 | 928 712 | 17.1 |
| 1980 | 1 588 632 | 817 410 | 771 222 | 13.6 |
| 1985 | 1 437 375 | 738 257 | 699 118 | 11.9 |
| 1990 | 1 229 044 | 630 863 | 598 181 | 9.9 |
| 1995 | 1 197 427 | 613 907 | 583 520 | 9.5 |
| 2000 | 1 202 761 | 618 374 | 584 387 | 9.5 |
| 2001 | 1 182 499 | 607 135 | 575 364 | 9.3 |
| 2002 | 1 165 466 | 598 744 | 566 722 | 9.1 |
| 2003 | 1 134 767 | 582 568 | 552 199 | 8.9 |
| 2004 | 1 122 344 | 575 533 | 546 811 | 8.8 |
| 2005 | 1 073 915 | 550 879 | 523 036 | 8.4 |
| 2006 | 1 104 862 | 566 692 | 538 170 | 8.6 |
Observing trends in live birth rates by age group of mother, they decreased among mothers who are in their 20s, and increased among mothers who are in “ages 35-39” and “ages 40-44”. In addition, in 2006, live birth rates exceeded figures in the preceding year among mothers, except for those who are in “ages 15-19” (Figure 2).
Figure 2. Yearly comparison of live birth rates by age group of mother, 1990, 1995,
2000, 2005 and 2006
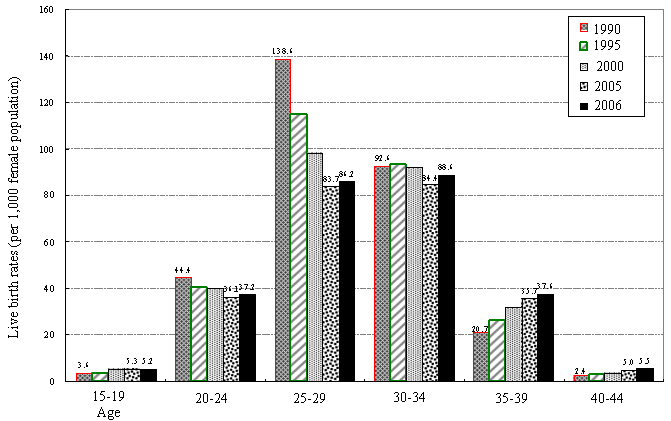
Note: Live births used for “ages 15-19” include those for 14 years old or younger. |
Regarding trends in live births according to legitimate child or illegitimate child, the proportion of legitimate children has been demonstrating a downward trend, and, in contrast, that of illegitimate children has been demonstrating an upward trend (Table 2).
Table 2. Trends in live births and percent distribution by legitimate child and
illegitimate child, 1992-2006
| Year | Live births (persons) | Percentage (%) | ||||
| Total | Legitimate child |
Illegitimate child |
Total | Legitimate child |
Illegitimate child |
|
| 1992 | 1 218 265 | 1 203 688 | 14 577 | 100.0 | 98.8 | 1.2 |
| 93 | 1 197 900 | 1 183 161 | 14 739 | 100.0 | 98.8 | 1.2 |
| 94 | 1 248 850 | 1 232 728 | 16 122 | 100.0 | 98.7 | 1.3 |
| 95 | 1 197 427 | 1 181 152 | 16 275 | 100.0 | 98.6 | 1.4 |
| 96 | 1 217 925 | 1 200 572 | 17 353 | 100.0 | 98.6 | 1.4 |
| 97 | 1 203 888 | 1 184 958 | 18 930 | 100.0 | 98.4 | 1.6 |
| 98 | 1 215 754 | 1 196 198 | 19 556 | 100.0 | 98.4 | 1.6 |
| 99 | 1 189 774 | 1 169 014 | 20 760 | 100.0 | 98.3 | 1.7 |
| 2000 | 1 202 761 | 1 180 950 | 21 811 | 100.0 | 98.2 | 1.8 |
| 01 | 1 182 499 | 1 159 437 | 23 062 | 100.0 | 98 | 2 |
| 02 | 1 165 466 | 1 141 055 | 24 411 | 100.0 | 97.9 | 2.1 |
| 03 | 1 134 767 | 1 110 364 | 24 403 | 100.0 | 97.8 | 2.2 |
| 04 | 1 122 344 | 1 097 480 | 24 864 | 100.0 | 97.8 | 2.2 |
| 05 | 1 073 915 | 1 049 688 | 24 227 | 100.0 | 97.7 | 2.3 |
| 06 | 1 104 862 | 1 079 043 | 25 819 | 100.0 | 97.7 | 2.3 |
Observing combined parent nationalities, according to the nationality of the mother, the percent distributions are particularly high for children who have mothers possessing the nationality of Philippines or Thailand, and Japanese fathers (Table 3).
Table 3. Live births and percent distribution by nationality of father and mother, 2006
| Nationality of mother |
Total | Nationality of father | Illegitimate child |
|||||||||||
| Japan | Foreign countries | |||||||||||||
| Total | Korea | China | Philippines | Thailand | U.S.A. | United Kingd om |
Brazil | Peru | Other foreign countries |
|||||
| Live births (persons) | ||||||||||||||
| Total | 1 104 862 | 1 060 226 | 18 817 | 4 293 | 3 481 | 475 | 110 | 1 957 | 447 | 2 385 | 622 | 5 047 | 25 819 | |
| Japan | 1 078 634 | 1 046 186 | 9 423 | 2 680 | 949 | 145 | 75 | 1 635 | 362 | 334 | 141 | 3 102 | 23 025 | |
| Foreign countries | 26 228 | 14 040 | 9 394 | 1 613 | 2 532 | 330 | 35 | 322 | 85 | 2 051 | 481 | 1 945 | 2 794 | |
| . Korea | 4 385 | 2 593 | 1 605 | 1 527 | 17 | - | - | 15 | 2 | 4 | 2 | 38 | 187 | |
| China | 6 805 | 3 925 | 2 612 | 40 | 2 505 | 4 | 1 | 9 | 8 | 9 | 1 | 35 | 268 | |
| Philippines | 6 250 | 4 998 | 495 | 20 | 3 | 320 | - | 27 | 2 | 69 | 11 | 43 | 757 | |
| Thailand | 652 | 512 | 60 | 2 | 1 | - | 31 | 3 | 2 | 11 | 1 | 9 | 80 | |
| U.S.A. | 403 | 130 | 256 | 4 | 1 | 1 | - | 219 | 7 | - | - | 24 | 17 | |
| United Kingdom |
112 | 51 | 57 | - | - | - | - | 3 | 45 | - | - | 9 | 4 | |
| Brazil | 3 210 | 256 | 1 954 | - | - | 1 | 1 | 9 | - | 1 877 | 35 | 31 | 1 000 | |
| Peru | 830 | 99 | 481 | - | - | 2 | - | 4 | - | 49 | 398 | 28 | 250 | |
| Other foreign countries |
3 581 | 1 476 | 1 874 | 20 | 5 | 2 | 2 | 33 | 19 | 32 | 33 | 1 728 | 231 | |
| Percent distribution of father’s nationality by nationality of mother (%) | ||||||||||||||
| Total | 100.0 | 96.0 | 1.7 | 0.4 | 0.3 | 0.0 | 0.0 | 0.2 | 0.0 | 0.2 | 0.1 | 0.5 | 2.3 | |
| Japan | 100.0 | 97.0 | 0.9 | 0.2 | 0.1 | 0.0 | 0.0 | 0.2 | 0.0 | 0.0 | 0.0 | 0.3 | 2.1 | |
| Foreign countries | 100.0 | 53.5 | 35.8 | 6.1 | 9.7 | 1.3 | 0.1 | 1.2 | 0.3 | 7.8 | 1.8 | 7.4 | 10.7 | |
| . Korea | 100.0 | 59.1 | 36.6 | 34.8 | 0.4 | - | - | 0.3 | 0.0 | 0.1 | 0.0 | 0.9 | 4.3 | |
| China | 100.0 | 57.7 | 38.4 | 0.6 | 36.8 | 0.1 | 0.0 | 0.1 | 0.1 | 0.1 | 0.0 | 0.5 | 3.9 | |
| Philippines | 100.0 | 80.0 | 7.9 | 0.3 | 0.0 | 5.1 | - | 0.4 | 0.0 | 1.1 | 0.2 | 0.7 | 12.1 | |
| Thailand | 100.0 | 78.5 | 9.2 | 0.3 | 0.2 | - | 4.8 | 0.5 | 0.3 | 1.7 | 0.2 | 1.4 | 12.3 | |
| U.S.A. | 100.0 | 32.3 | 63.5 | 1.0 | 0.2 | 0.2 | - | 54.3 | 1.7 | - | - | 6.0 | 4.2 | |
| United Kingdom |
100.0 | 45.5 | 50.9 | - | - | - | - | 2.7 | 40.2 | - | - | 8.0 | 3.6 | |
| Brazil | 100.0 | 8.0 | 60.9 | - | - | 0.0 | 0.0 | 0.3 | - | 58.5 | 1.1 | 1.0 | 31.2 | |
| Peru | 100.0 | 11.9 | 58.0 | - | - | 0.2 | - | 0.5 | - | 5.9 | 48.0 | 3.4 | 30.1 | |
| Other foreign countries |
100.0 | 41.2 | 52.3 | 0.6 | 0.1 | 0.1 | 0.1 | 0.9 | 0.5 | 0.9 | 0.9 | 48.3 | 6.5 | |
Live births in 2006 were at 1.1 million, of which those of Japanese in Japan were 1.09 million, accounting for 98.9 percent of the total. Furthermore, among live births of Japanese in Japan, those of Japanese mothers were 1.08 million, accounting for 98.7 percent (Table 4).
Table 4. Live births and percent distribution by nationality of father and mother
(Japanese or foreign), 2006
Notes: 1) Live births of Japanese in Japan: 1,092,674 persons (shaded area) 2) Figures in parentheses indicate percent distributions to live births of Japanese in Japan. |
||||||||||||||||||||||||||||||||||