(4) Burdens and Worries concerning Child Rearing
Responses with “financial burdens” further increased, accounting for the largest proportion.
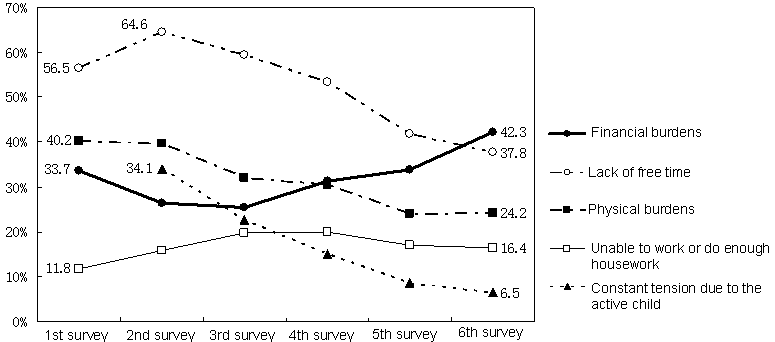
With regard to changes in burdens and worries concerning child rearing (multiple answers), the respondents with “financial burdens” significantly increased and accounted for the largest proportion (42.3%) for the first time since the 1st survey, followed by those with “lack of free time” (37.8%) (Figure 17, Table 13).
| Figure 17 | Changes in main burdens and worries concerning child rearing
(multiple answers) |

| Notes: |
| 1) |
The figures are based on the total number of responses in the 1st through 6th surveys (total number of replies: 35,783). |
| 2) |
“Unable to work or do enough housework” was “unable to work enough” in the 1st and 2nd surveys. |
| 3) |
“Constant tension due to the active child” was not investigated in the 1st survey. |
|
| Table 13 | Changes in burdens and worries concerning child rearing
(multiple answers) |
(Unit: %)
| |
1st survey |
2nd survey |
3rd survey |
4th survey |
5th survey |
6th survey |
| Total |
100.0 |
100.0 |
100.0 |
100.0 |
100.0 |
100.0 |
| |
|
|
|
|
|
|
| Financial burdens |
33.7 |
26.4 |
25.4 |
31.2 |
33.8 |
42.3 |
| Lack of free time |
56.5 |
64.6 |
59.4 |
53.4 |
41.8 |
37.8 |
| Physical burdens |
40.2 |
39.7 |
32.1 |
30.5 |
24.0 |
24.2 |
| No tolerance toward the child |
・ |
・ |
・ |
23.0 |
26.2 |
23.9 |
| Disobedience of the child |
・ |
・ |
21.9 |
27.5 |
23.0 |
19.3 |
| |
|
|
|
|
|
|
| Unable to work or do enough housework |
11.8 |
15.8 |
19.8 |
19.9 |
17.0 |
16.4 |
| Parental disagreement over discipline |
・ |
・ |
9.2 |
11.7 |
11.2 |
11.5 |
No caregiver when temporary childcare is
needed |
・ |
・ |
12.0 |
11.1 |
10.5 |
10.6 |
Concerned about what people think or say
about the child |
・ |
・ |
5.0 |
8.2 |
7.6 |
8.5 |
| Concerned about the growth of the child |
・ |
・ |
7.0 |
7.5 |
7.2 |
7.8 |
| |
|
|
|
|
|
|
| Constant tension due to the active child |
・ |
34.1 |
22.7 |
15.1 |
8.7 |
6.5 |
| Lack of partner's involvement in child rearing |
・ |
・ |
6.0 |
6.7 |
6.4 |
6.4 |
| Do not know how to discipline the child |
・ |
・ |
8.6 |
7.3 |
7.8 |
6.0 |
No doctor available in the neighborhood for
sudden illness |
・ |
・ |
3.4 |
3.4 |
3.7 |
3.9 |
| Child being prone to illness |
3.3 |
6.3 |
4.0 |
3.8 |
4.4 |
3.5 |
| |
|
|
|
|
|
|
Unable to build a good relationship with other
parents |
・ |
・ |
1.2 |
1.6 |
2.1 |
2.6 |
| Child reluctant to go to school or kindergarten |
・ |
・ |
・ |
2.5 |
2.4 |
1.5 |
| No affection to the child |
・ |
・ |
0.3 |
0.4 |
0.5 |
0.4 |
| Others |
6.0 |
3.9 |
3.0 |
3.4 |
3.4 |
3.5 |
| |
|
|
|
|
|
|
| No particular burdens or worries |
19.7 |
12.2 |
13.0 |
12.1 |
15.5 |
15.6 |
| Unknown |
0.5 |
2.1 |
0.7 |
0.9 |
2.1 |
1.8 |
| Notes: |
| 1) |
The figures are based on the total number of responses in the 1st through 6th surveys (total number of replies: 35,783). |
| 2) |
“Unable to work or do enough housework” was “unable to work enough” in the 1st and 2nd surveys. |
|
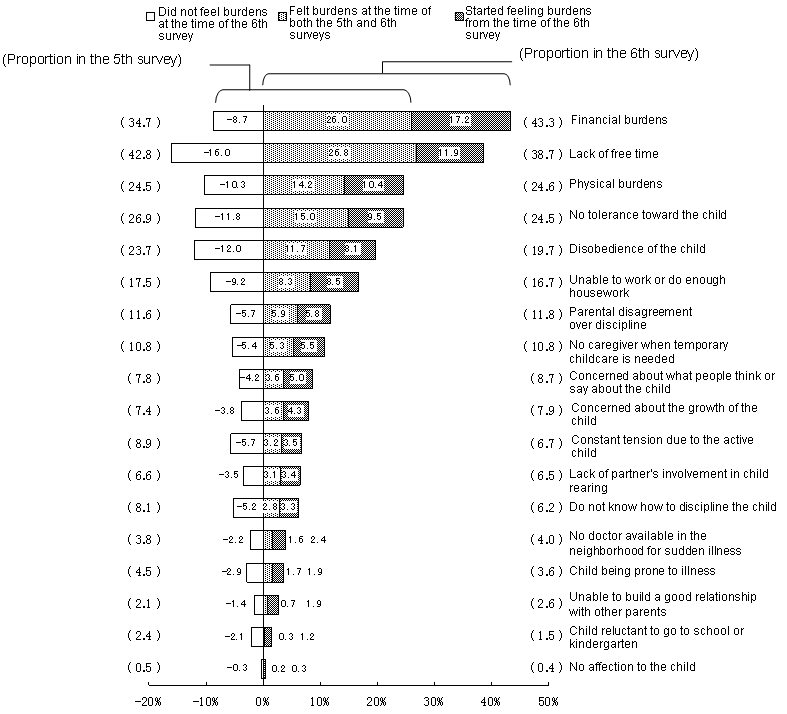
As for changes in “financial burdens” from the time of the 5th survey, the respondents with “started feeling burdens from the time of the 6th survey” accounted for 17.2% and those with “did not feel burdens at the time of the 6th survey” 8.7%.
On the other hand, concerning the respondents with “lack of free time”, the highest in the past surveys, the proportion of “did not feel burdens at the time of the 6th survey” was 16.0% and that of “started feeling burdens from the time of the 6th survey” 11.9%.
As children grow, respondents come to feel no burdens from what they used to feel burdens and the types of their worries change (Figure 18).
| Figure 18 | Changes in burdens and worries concerning child rearing
(multiple answers) from the time of the 5th survey |

| Notes: |
| 1) |
The figures are based on the total number of responses to “burdens and worries concerning child rearing” in the 5th and 6th
surveys (total number of replies: 35,886). |
| 2) |
“Did not feel burdens at the time of the 6th survey” indicates the respondents who did not reply to feel burdens in the 6th
survey among those who replied to feel burdens in the 5th survey.
“Felt burdens at the time of both the 5th and 6th surveys” indicates the respondents who replied to feel burdens in the 6th
survey among those who replied to feel burdens in the 5th survey.
“Started feeling burdens from the time of the 6th survey” indicates the respondents who replied to feel burdens in the 6th
survey among those who did not reply to feel burdens in the 5th survey. |
|
Burdens and worries concerning child rearing vary in relation to mothers’ employment status and time to return home.
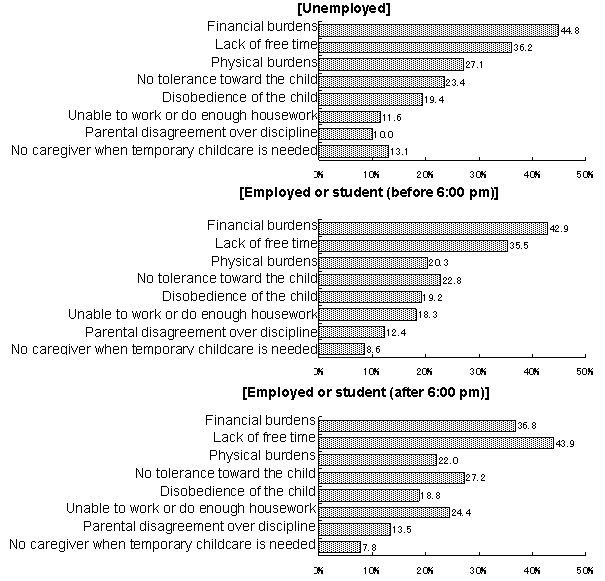
According to the breakdown of major burdens and worries concerning child rearing in relation to mothers’ employment status and time to return home, “financial burdens” accounted for the highest proportion of 44.8% among “unemployed” mothers, followed by “lack of free time” (36.2%) and “physical burdens” (27.1%).
As for mothers who are employed or students and whose time to return home is “before 6:00 pm”, the highest proportion is 42.9% for “financial burdens”, followed by “lack of free time” (35.5%) and “no tolerance toward the child” (22.8%).
On the other hand, as for mothers whose time to return home is “after 6:00 pm”, the highest proportion is 43.9% for “lack of free time”, followed by “financial burdens” (36.8%) and “no tolerance toward the child” (27.2%), showing that burdens and worries vary in relation to mothers’ employment status and time to return home (Figure 19).
| Figure 19 | Major burdens and worries concerning child rearing in relation to mothers’
employment status and time to return home (multiple answers) |

| Notes: |
| 1) |
The figures are based on the total number of responses with children living with their mothers in the 6th survey (total number of replies:
38,201). |
| 2) |
“Unemployed” does not include “student”. |
| 3) |
Category of mothers’ time to return home and the proportion to the total and the proportion of respondents with children living with their
mothers to total are as follows.
Mothers’ time to return home: “Unemployed”: 46.7%
“Employed or student (before 6:00 pm)” (6:00 am- before 6:00 pm): 28.1%
“Employed or student (after 6:00 pm)” (6:00 pm- before 6:00 am): 19.7%
Respondents: “A mother only”: 92.6%, “A father only”: 5.7%, “Parents only”: 1.0%,
“Other combinations”: 0.3%, “Unknown”: 0.4%
|
|


