(5) Computer Games
Over 50% of children play computer games.
50.6% of children “play computer games”, including TV games and mobile games, increased by 22.7% compared with those who “play computer games” in the 5th survey (Figure 11).
Comparing ordinary days with Sundays, children who “play” on Sundays account for larger proportion than ordinary days, 48.0%. With regard to boys, over 50% play on Sundays (53.3%). “Less than 1 hour” is the largest concerning hours spent playing computer games on both ordinary days and Sundays (Table 8).
With regard to the combination of ordinary days and Sundays, children who play both on ordinary days and Sundays account for 37.0%, those only on Sundays 10.8%, and those only on ordinary days 2.0% (Table 9).
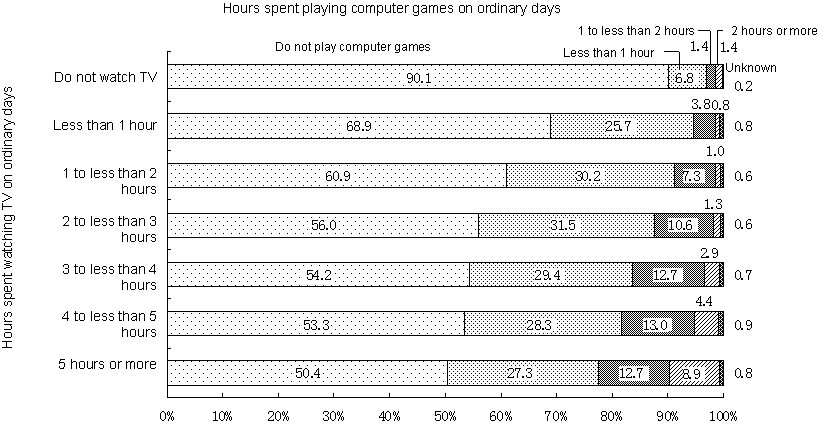
Concerning the proportion of children who play computer games according to hours spent watching TV on ordinary days, the longer children watch TV, the higher the proportion of children who play computer games becomes (Figure 12).
Figure 11 Changes in the status of playing computer games

| Notes: |
| 1) |
The figures are based on the total number of responses to “hours spent playing computer games” in the 5th and 6th surveys (total
number of replies: 36,844). |
| 2) |
In the 5th survey, “How long do you play computer games on an ordinary day?” was investigated.
In the 6th survey, “hours spent playing computer games per day” on “ordinary days” and “Sundays” were investigated separately. |
| 3) |
“Play computer games” in the 6th survey indicates children who play computer games both or either on ordinary days and/or Sundays.
While, “do not play computer games” indicates children who do not play computer games both on ordinary days and Sundays. |
|
| Table 8 | Hours spent playing computer games on ordinary days and Sundays
according to sex |
(Unit: %)
| |
Total |
Do not play
computer
games |
Play
computer
games |
|
Unknown |
Less than
1 hour |
1 to less than
2 hours |
2 to less than
3 hours |
3 hours or
more |
| Ordinary days |
Total |
100.0 |
60.0 |
39.2 |
29.3 |
8.4 |
1.1 |
0.3 |
0.8 |
| |
Boys |
100.0 |
54.3 |
44.9 |
30.6 |
12.1 |
1.8 |
0.5 |
0.8 |
| |
Girls |
100.0 |
66.2 |
33.0 |
28.0 |
4.5 |
0.5 |
0.1 |
0.8 |
| Sundays |
Total |
100.0 |
51.0 |
48.0 |
29.7 |
13.4 |
3.5 |
1.4 |
1.0 |
| |
Boys |
100.0 |
45.7 |
53.3 |
28.6 |
17.3 |
5.1 |
2.3 |
1.0 |
| |
Girls |
100.0 |
56.8 |
42.2 |
30.9 |
9.2 |
1.7 |
0.4 |
1.0 |
| Note: |
The figures are based on the total number of responses in the 6th survey (total number of replies: 38,535 (boys: 20,013, girls: 18,522)). |
Table 9 Combination of days on which children play computer games
(Unit: %)
| |
Ordinary days |
| Total |
Do not play
computer games |
Play computer
games |
Unknown |
| Sundays |
Total |
100.0 |
60.0 |
39.2 |
0.8 |
| Do not play computer games |
51.0 |
49.0 |
2.0 |
0.0 |
| Play computer games |
48.0 |
10.8 |
37.0 |
0.1 |
| Unknown |
1.0 |
0.1 |
0.2 |
0.7 |
| Note: |
The figures are based on the total number of responses in the 6th survey (total number of replies: 38,535). |
|
| Figure 12 | Hours spent playing computer games according to hours spent watching
TV on ordinary days |

| Notes: |
| 1) |
The figures are based on the total number of responses in the 6th survey (total number of replies: 38,535). |
| 2) |
The proportion of hours spent watching TV on ordinary days to the total is as follows.
Do not watch TV: 1.1%,
Less than 1 hour: 15.9%,
1 to less than 2 hours: 39.9%,
2 to less than 3 hours: 28.0%,
3 to less than 4 hours: 10.5%,
4 to less than 5 hours: 3.2%,
5 hours or more: 1.0%
|
|

