Ministry of Health, Labour and Welfare

Japanese

(3) Employment Status of Mothers
1) Employed or unemployed

The proportion of employed mothers exceeded 50%.

The proportion of “employed” mothers was 54.5% one year prior to childbirth, and decreased to 25.1% in the 1st survey (6 months after childbirth). It increased year by year and reached 51.4% in the 6th survey. The proportion is returning to the same level of “employed” mothers as one year prior to childbirth (Figure 2).

Referring to the employment status of mothers in relation to the existence of younger sibling(s), the rate of “employed” mothers with children without younger sibling is 59.4%.

In addition, with regard to the age of the youngest sibling among children with younger sibling(s), the higher the age is, the higher the proportion of “employed” mothers becomes (Table 2).

Figure 2 Changes in the proportion of employed and unemployed mothers
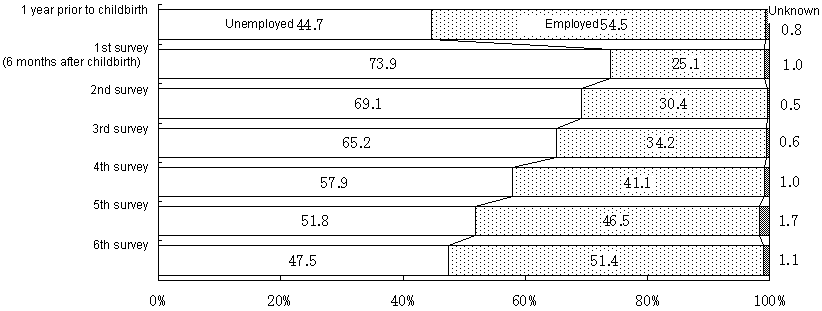
Figure 2  Changes in the proportion of employed and unemployed mothers
Note: The figures are based on the total number of responses with children living with their mothers in the 1st through 6th surveys
(total number of replies: 35,361).

Table 2 Employment status of mothers in relation to the existence of younger sibling(s) and sibling composition

(Unit: %)
  Total Unemployed Employed  
Full-time
worker
Part-time
worker
Self-employed
worker/family
worker
Pieceworker
at home
Others
Existence of younger
sibling(s)
Total

(100.0)

100.0

46.9

51.9

16.8

26.1

5.8

2.6

0.6

Without younger sibling

(57.5)

100.0

39.4

59.4

17.8

31.9

6.3

2.7

0.7

With younger sibling(s)

(42.0)

100.0

57.2

41.6

15.5

18.0

5.2

2.5

0.5

Age of the youngest sibling:
0 year old

(5.8)

100.0

66.9

32.0

15.6

9.1

5.1

1.2

1.1

1 year old

(8.1)

100.0

62.1

36.7

16.1

13.1

5.0

2.0

0.5

2 years old

(11.7)

100.0

60.5

38.3

15.6

15.0

4.6

2.7

0.4

3 years old

(13.0)

100.0

51.3

47.5

14.8

23.7

5.3

3.3

0.5

4 or 5 years old

(3.4)

100.0

40.2

58.8

15.7

33.3

7.1

2.2

0.5

Sibling composition (Without younger sibling)


Only child

(16.1)

100.0

40.4

58.4

21.8

29.2

5.0

1.7

0.7

Elder sibling(s) only

(41.3)

100.0

39.0

59.7

16.2

33.0

6.8

3.1

0.6

(With younger sibling(s))


Younger sibling(s) only

(32.3)

100.0

58.4

40.5

16.0

17.5

4.2

2.2

0.6

Both elder and younger siblings

(9.7)

100.0

53.1

45.5

13.7

19.7

8.3

3.4

0.5

Notes:
1) The figures are based on the total number of responses with children living with their mothers in the 6th survey (total number of replies: 38,201).
2) The total includes the number of responses with “unknown” concerning the existence of younger sibling(s), sibling composition, and the employment status of mothers.
3) “Full-time worker” indicates “employee (full-time)” and “part-time worker” indicates “employee (part-time)”.
2) Changes in the employment status of mothers

The number of mothers who work as “part-time workers” is on the increase.

With regard to changes in the employment status of mothers, the proportion of “part-time workers” increased year by year from the 1st survey (6 months after childbirth) (3.7%) through the 6th survey (25.8%). Meanwhile, the proportion of “full-time workers” did not change significantly after the 1st survey (6 months after childbirth) and was 16.5% in the 6th survey (Figure 3-1).

About 30% of mothers continue to work as “full-time workers” among mothers who worked as “full-time workers” one year prior to childbirth.

With regard to changes in the employment status of mothers who worked as “full-time workers” one year prior to childbirth, the proportion of “full-time workers” decreased to 47.6% in the 1st survey (6 months after childbirth) and was 39.9% in the 6th survey.

Among mothers who worked as “full-time workers” one year prior to childbirth, 30.9 % of mothers continue to work as “full-time workers” until the 6th survey.

The proportion of mothers who worked as “full-time workers” one year prior to childbirth became “unemployed” in the 1st survey (6 months after childbirth) was 48.8%. However, “unemployed” has been on the decrease year by year and was 34.4% in the 6th survey (Figure 3-2).
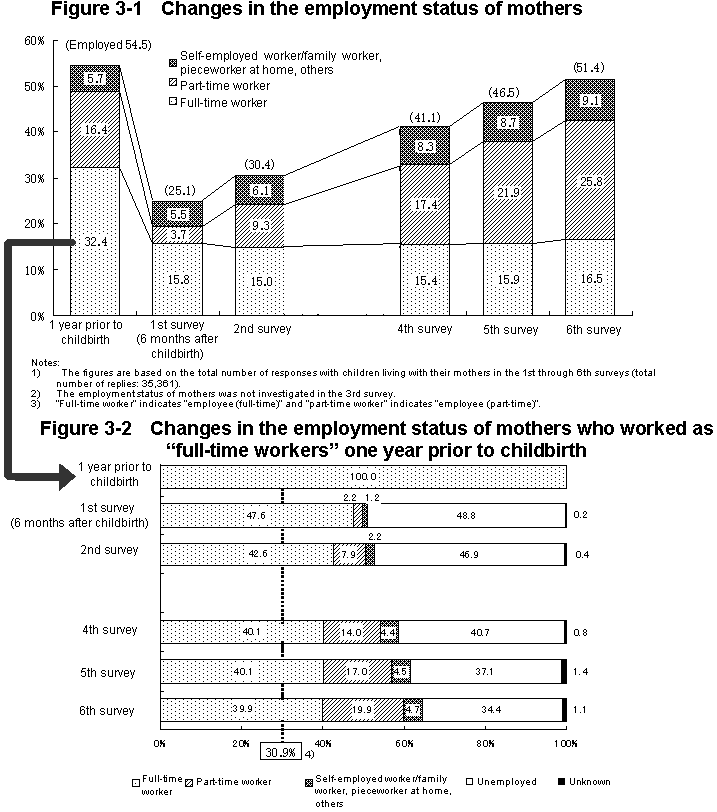
Figure 3-1  Changes in the employment status of mothers / Figure 3-2  Changes in the employment status of mothers who worked as “full-time workers” one year prior to childbirth
Notes:
1) The figures are based on the responses in the 1st through 6th surveys with children living with their mothers who worked as “full-time
workers” one year prior to childbirth (total number of replies: 11,444). The proportion of “full-time workers” “1 year prior to childbirth” (32.4%)
in Figure 3-1 is considered 100.
2) The employment status of mothers was not investigated in the 3rd survey.
3) “Full-time worker” indicates “employee (full-time)” and “part-time worker” indicates “employee (part-time)”.
4) The proportion of mothers who continue to work as “full-time workers” from one year prior to childbirth to the 6th survey (3,541 persons).

Return To Top