Overview

Overview

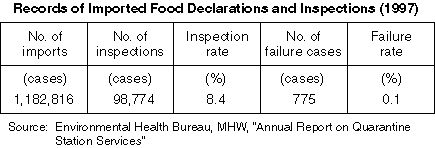
Overview
Structure of the Law Concerning the Examination and Regulation of the Manufacture of Chemical Substances
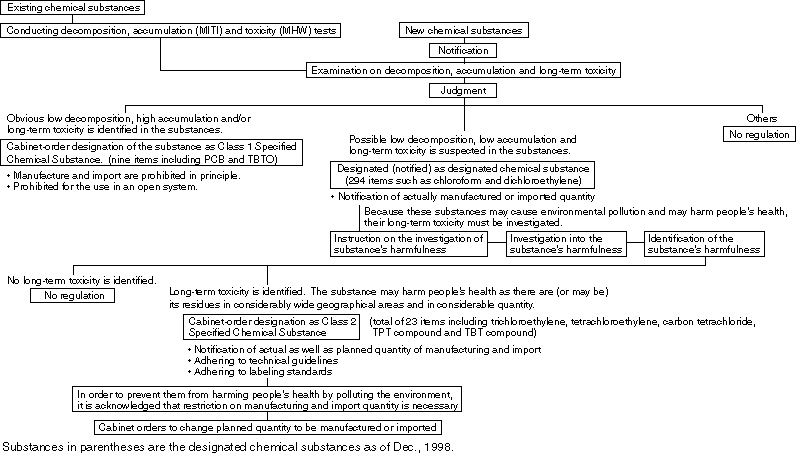
Overview
For the purpose of preventing health hazards caused by chemical substances contained in household products such as cleaners and aerosol products (atomizing corpuscular contents in the air) as well as textile products for clothing, MHW is authorized to designate products as containing "harmful substances" based on the Law for the Control of Household Products Containing Harmful Substances. Moreover, the Ministry sets forth standards for regulating the quantity of such harmful substances in household products that contain them so as to ensure the safety of household products.
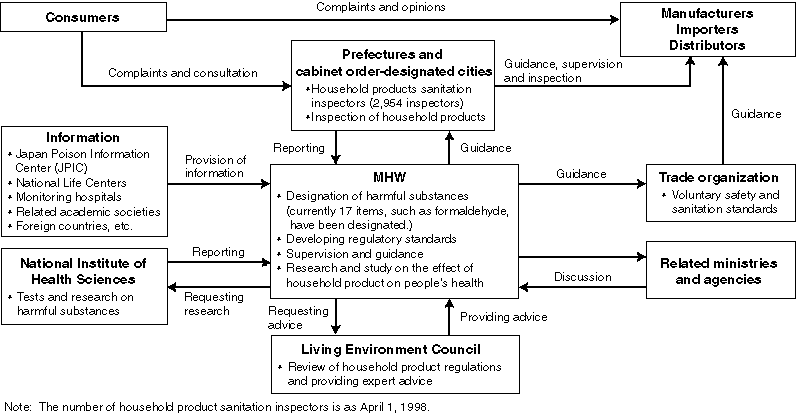
Overview
Waste Disposal Systems
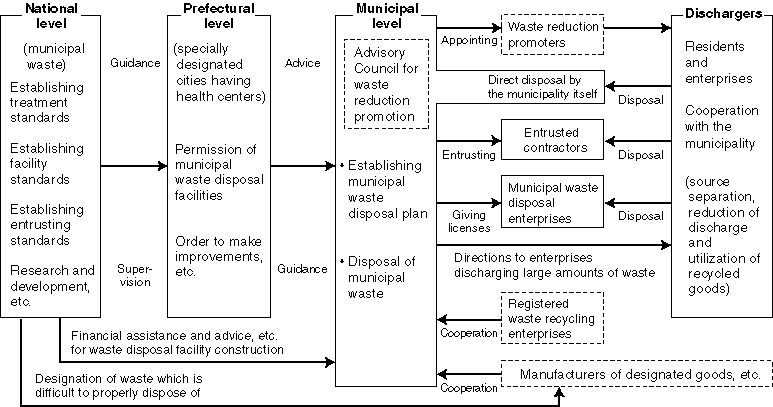
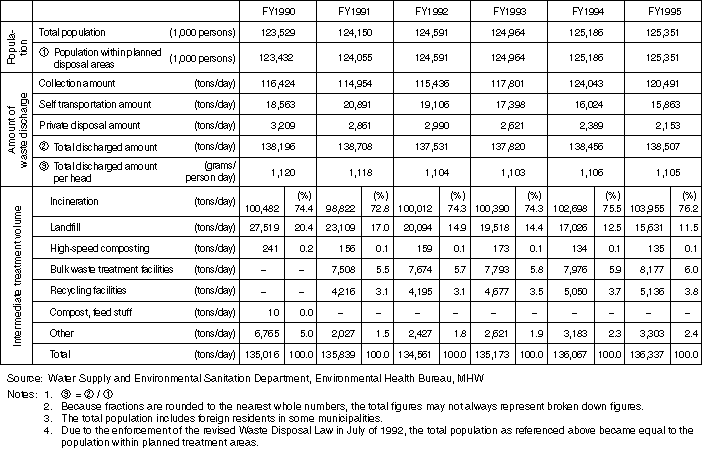
Detailed Data 1
Changes in Municipal Waste Disposal (nationwide)
Detailed Data 2
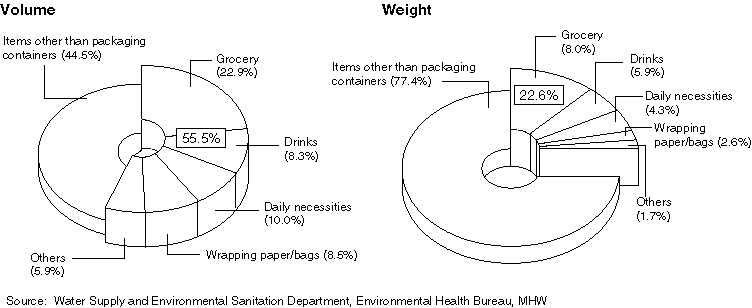
The Ratio of Containers/Packaging Waste to All Municipal Waste
Detailed Data 3
Standards for Concentration of Dioxin or Other Substances in Exhaust Gas from Waste Incineration Facilities

Detailed Data 4
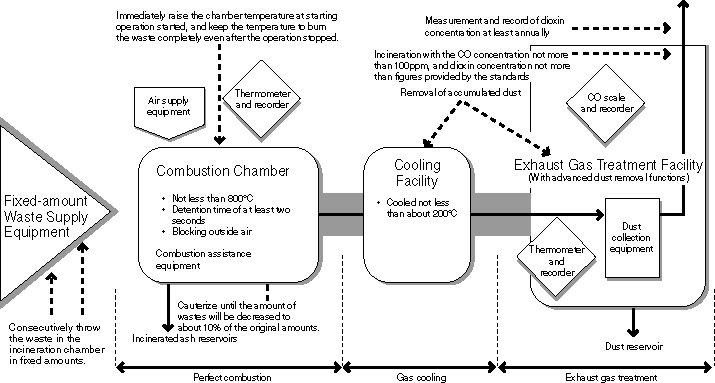
Structure of Waste Incineration Facilities and Maintenance Management Standards
Detailed Data 5
Changes in the Residual Capacity of Final Treatment Facilities

Detailed Data 6
Number of Municipalities Collecting Packaging Waste with Source Separation in FY1999

Overview
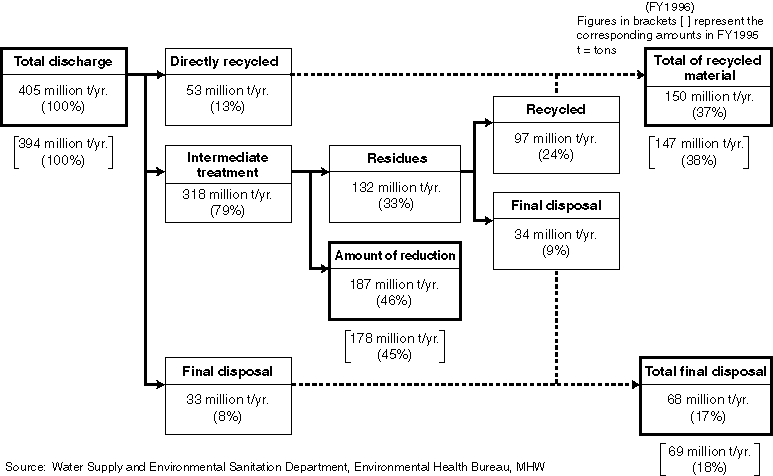
Industrial Waste Disposal Process (nationwide)
Detailed Data 1
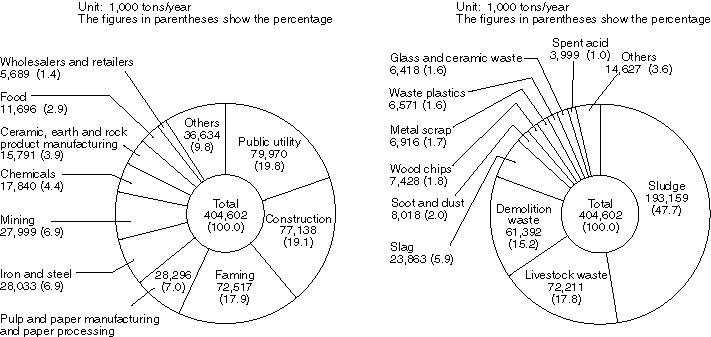
Industrial Waste Classified by Industry (FY1996)
Industrial Waste Classified by Type (FY1996)
Detailed Data 2
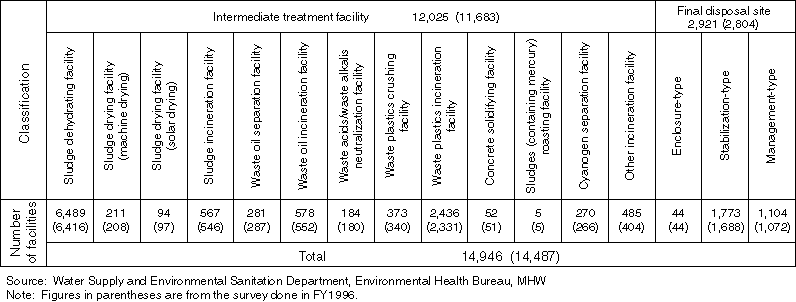
The Number of Disposal Facilities for Industrial Waste
(as of March 31, 1997)
Detailed Data 3
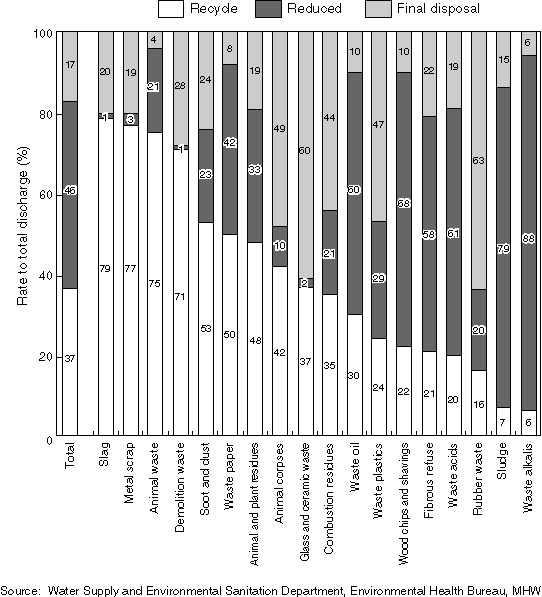
Recycling Rate, Rate of Reduction by Treatment and Final Disposal Rate of Industrial Waste by Type
Detailed Data 4
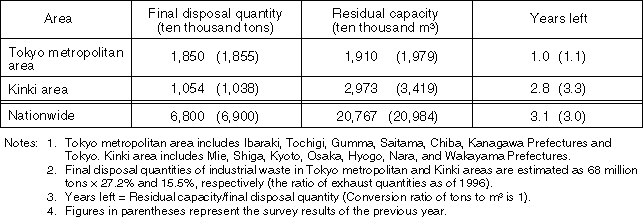
Residual Capacities and Years Left for Industrial Waste Final Disposal Sites (as of March 1997)
Years left until final disposal sites being full estimated by final disposal quantity of FY1996 and residual quantities show the same severe situations as the previous year, that is, 3.1 years nationwide and 1.0 year for the Tokyo metropolitan area.
Overview
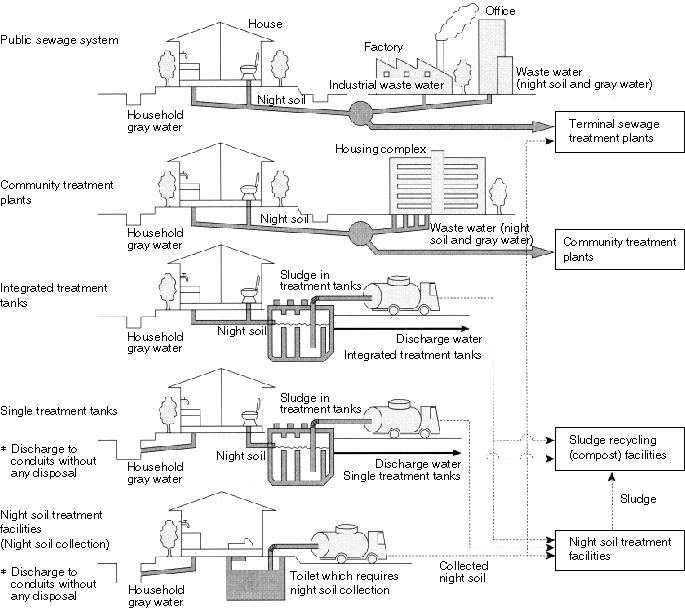
Non-Industrial Waste Water
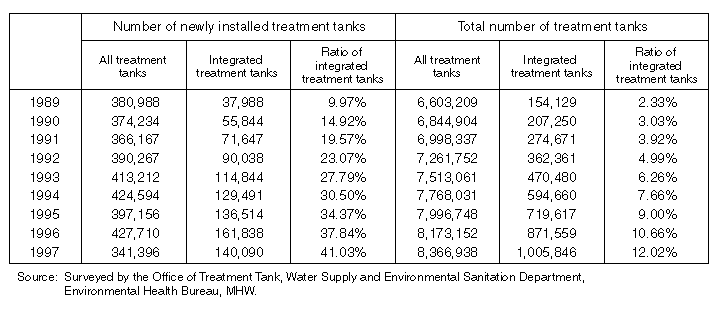
Non-industrial waste water, called "gray water," and night soil are discharged from areas such as the kitchen and the bathroom. Non-industrial waste water is treated through the following five methods: public sewage, community treatment plants, integrated treatment tanks, single treatment tanks and night soil treatment facilities (through night soil collection.) Among these methods, treatment tanks are used by about 40% of the Japanese population equipped with flush toilets. The installation of high-performance, compact-size integrated treatment tanks which treat gray water as well as night soil is rapidly spreading as a mainstay of the household waste water treatment policies and this is expected to increase in number in the future.
Detailed Data 1
Annual Changes in Number of Treatment Tank Installations
Overview
Comparison of Integrated Treatment Tanks and Single Treatment Tanks
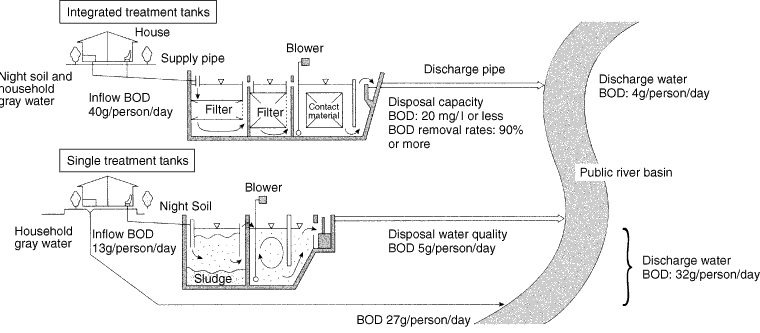
Advantages of Integrated Treatment
Detailed Data 1
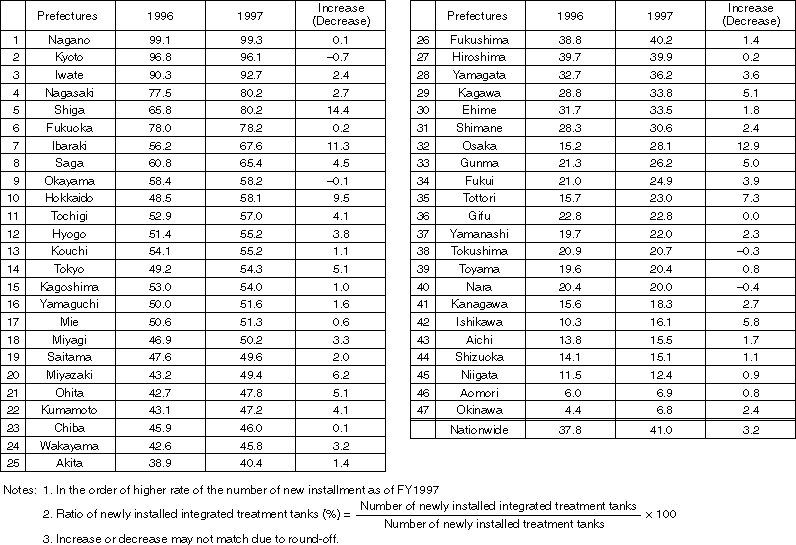
Ratio of Newly Installed Integrated Treatment Tanks in Prefectures (%) (change from 1996 to 1997)
Overview
The Water Supply Law sets standards for water quality and water supply facilities and specifies rules for the operation and management of the water supply service to ensure a stable supply of safe water.
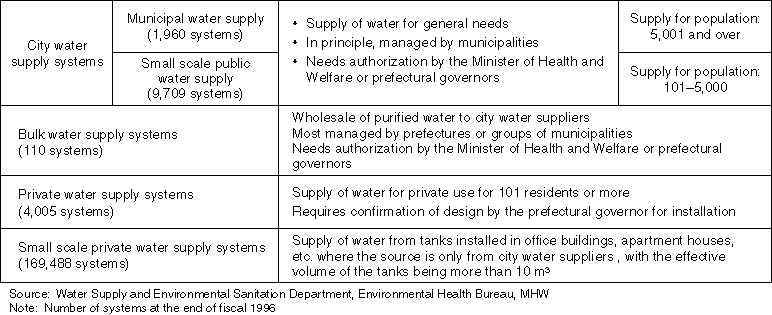
Detailed Data 1
Breakdown of the Population Covered by Water Supply System (WSS)

Detailed Data 2
Changes in the Volume of Supply in Municipal Water Supply System (WSS)

Detailed Data 3
Population Covered by WSS by Community Size
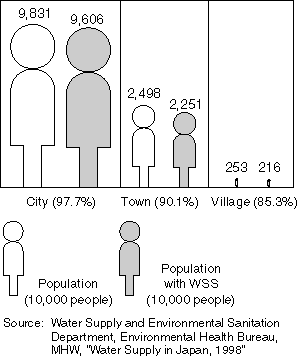
Detailed Data 4
Population Covered by WSS by Prefecture (as of March 31, 1997)
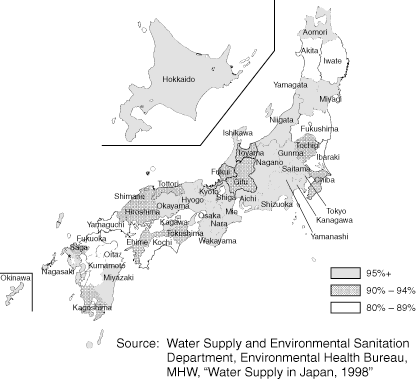
Detailed Data 5
Water Intake by Source (FY1996)
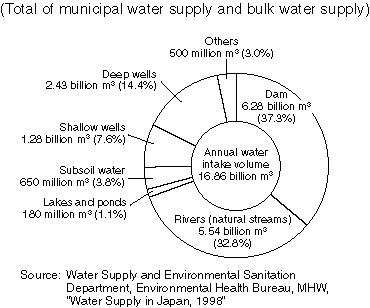
Detailed Data 6
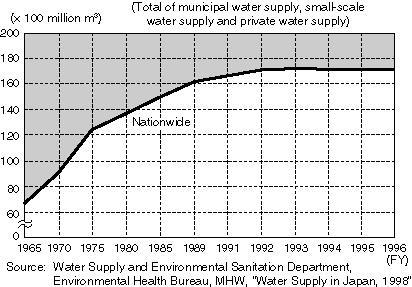
Changes in the Total Water Supply Volume per Year
Detailed Data 7
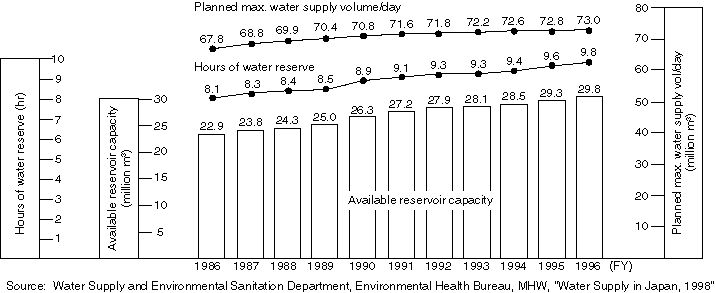
Available Reservoir Capacity, Water Supply Reserve Capacity (hours) and Planned Maximum Water Supply Volume per Day
Overview
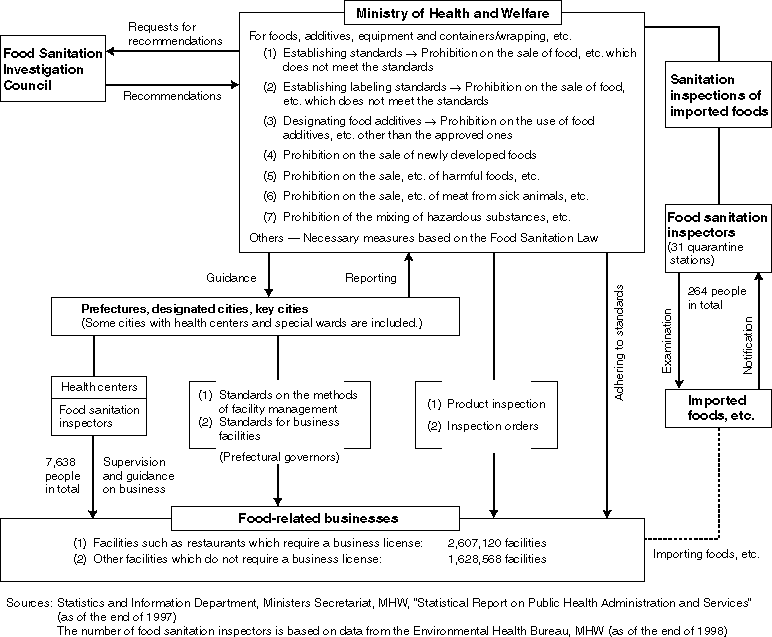
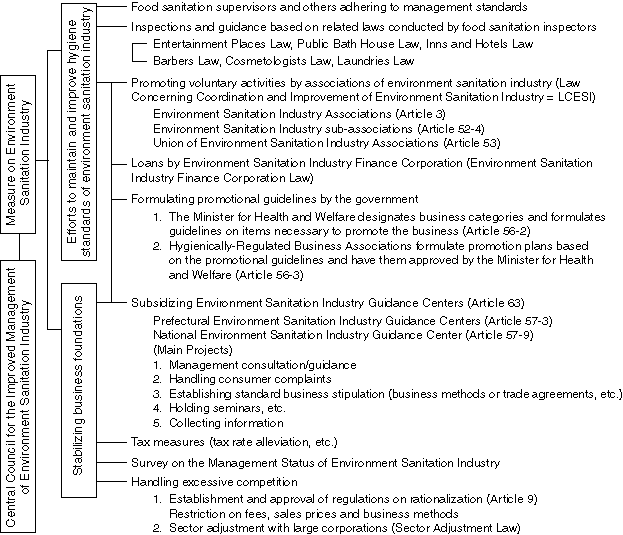
Structural Chart of Policy Implementation
Detailed Information 1
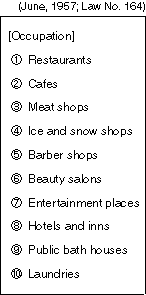
The Law Concerning Coordination and Improvement of the Environmental Sanitation Industry
Detailed Data 1
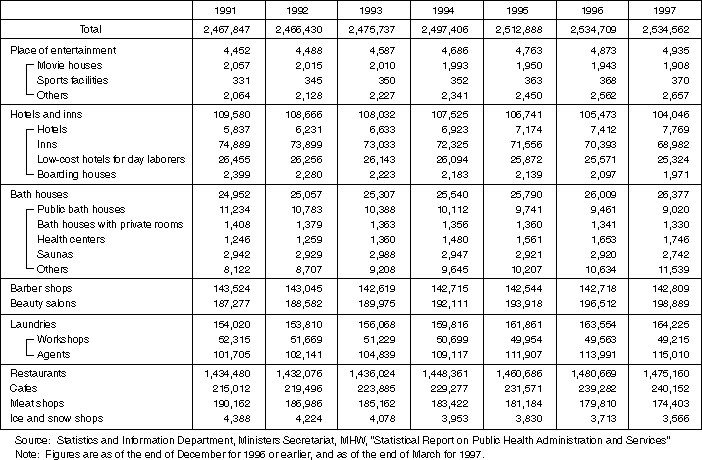
Annual Transition in the Number of Facilities of the Environmental Sanitation Industry
