(5) Marriages
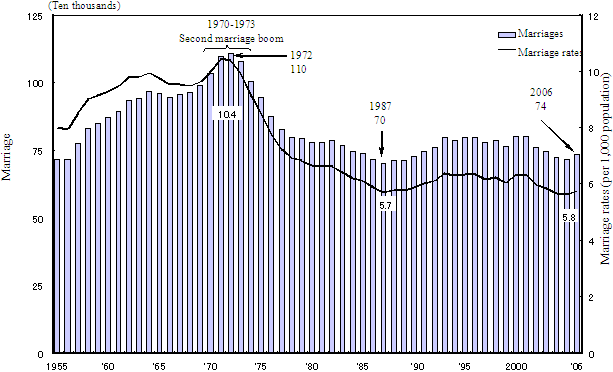
Regarding trends in marriages and marriage rates, while marriages and marriage rates had rapidly declined after the second marriage boom during 1970-1973, they rose after reaching a minimum in 1987. Although they had exhibited a downward trend since 2002, marriages were at 740,000 and the marriage rate was 5.8 in 2006, which exceeded the values in the preceding year (Figure 10).
Figure 10. Trends in marriages and marriage rates, 1955-2006

Observing the combined nationalities of bride and groom, according to nationality of the bride, the percentages of Japanese groom were high excluding U.S.A., Brazil, and Peru (Table 6).
Table 6. Marriages and percent distribution by nationality of bride and groom, 2006
| Nationality of bride |
Nationality of groom | |||||||||||
| Total | Japan | Foreign countries | ||||||||||
| Total | Korea | China | Philippines | Thailand | U.S.A. | United Kingdom |
Brazil | Peru | Other foreign countries |
|||
| Marriages (couples) | ||||||||||||
| Total | 735 132 | 722 263 | 12 869 | 3 320 | 1 507 | 230 | 118 | 1 999 | 428 | 1 393 | 398 | 3 476 |
| Japan | 694 978 | 686 270 | 8 708 | 2 335 | 1 084 | 195 | 54 | 1 474 | 386 | 292 | 115 | 2 773 |
| Foreign countries | 40 154 | 35 993 | 4 161 | 985 | 423 | 35 | 64 | 525 | 42 | 1 101 | 283 | 703 |
| . Korea | 6 989 | 6 041 | 948 | 845 | 35 | - | - | 26 | 4 | 2 | 3 | 33 |
| China | 12 667 | 12 131 | 536 | 84 | 363 | 1 | 2 | 23 | 7 | 13 | - | 43 |
| Philippines | 12 436 | 12 150 | 286 | 18 | 10 | 26 | - | 82 | - | 54 | 22 | 74 |
| Thailand | 1 774 | 1 676 | 98 | 5 | 3 | 1 | 60 | 3 | - | 11 | 1 | 14 |
| U.S.A. | 559 | 215 | 344 | 3 | 1 | 1 | - | 315 | 4 | 3 | - | 17 |
| United Kingdom |
97 | 79 | 18 | - | - | - | - | 3 | 9 | - | - | 6 |
| Brazil | 1 311 | 285 | 1 026 | - | 2 | 3 | - | 15 | 1 | 902 | 39 | 64 |
| Peru | 392 | 117 | 275 | - | - | - | 1 | 6 | 2 | 59 | 177 | 30 |
| Other foreign countries |
3 929 | 3 299 | 630 | 30 | 9 | 3 | 1 | 52 | 15 | 57 | 41 | 422 |
| Percent distribution of groom’s nationality by nationality of bride (%) | ||||||||||||
| Total | 100.0 | 98.2 | 1.8 | 0.5 | 0.2 | 0.0 | 0.0 | 0.3 | 0.1 | 0.2 | 0.1 | 0.5 |
| Japan | 100.0 | 98.7 | 1.3 | 0.3 | 0.2 | 0.0 | 0.0 | 0.2 | 0.1 | 0.0 | 0.0 | 0.4 |
| Foreign countries | 100.0 | 98.7 | 10.4 | 0.3 | 0.2 | 0.0 | 0.0 | 0.2 | 0.1 | 0.0 | 0.0 | 0.4 |
| Korea | 100.0 | 86.4 | 13.6 | 12.1 | 0.5 | - | - | 0.4 | 0.1 | 0.0 | 0.0 | 0.5 |
| China | 100.0 | 95.8 | 4.2 | 0.7 | 2.9 | 0.0 | 0.0 | 0.2 | 0.1 | 0.1 | - | 0.3 |
| Philippines | 100.0 | 97.7 | 2.3 | 0.1 | 0.1 | 0.2 | - | 0.7 | - | 0.4 | 0.2 | 0.6 |
| Thailand | 100.0 | 94.5 | 5.5 | 0.3 | 0.2 | 0.1 | 3.4 | 0.2 | - | 0.6 | 0.1 | 0.8 |
| U.S.A. | 100.0 | 38.5 | 61.5 | 0.5 | 0.2 | 0.2 | - | 56.4 | 0.7 | 0.5 | - | 3.0 |
| United Kingdom |
100.0 | 81.4 | 18.6 | - | - | - | - | 3.1 | 9.3 | - | - | 6.2 |
| Brazil | 100.0 | 21.7 | 78.3 | - | 0.2 | 0.2 | - | 1.1 | 0.1 | 68.8 | 3.0 | 4.9 |
| Peru | 100.0 | 29.8 | 70.2 | - | - | - | 0.3 | 1.5 | 0.5 | 15.1 | 45.2 | 7.7 |
| Other foreign countries |
100.0 | 84.0 | 16.0 | 0.8 | 0.2 | 0.1 | 0.0 | 1.3 | 0.4 | 1.5 | 1.0 | 10.7 |
