(4) TV
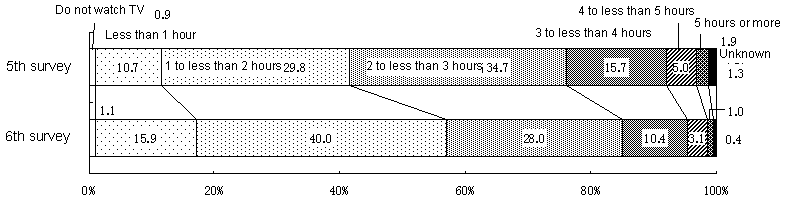
The largest proportion in terms of hours spent watching TV has become “1 to less than 2 hours”.
Comparing hours spent watching TV (including videos and DVDs) on ordinary days with those in the 5th survey, “2 hours or more” decreased and “1 to less than 2 hours” accounted for the highest proportion, 40.0% (Figure 9).
With regard to “1 to less than 2 hours” on ordinary days, the proportion of “1 to less than 2 hours” on Sundays was the highest, accounting for 44.9%, followed by “2 to less than 3 hours”, 40.2%. About 50% of respondents watched TV for 2 hours or more (Table 6).
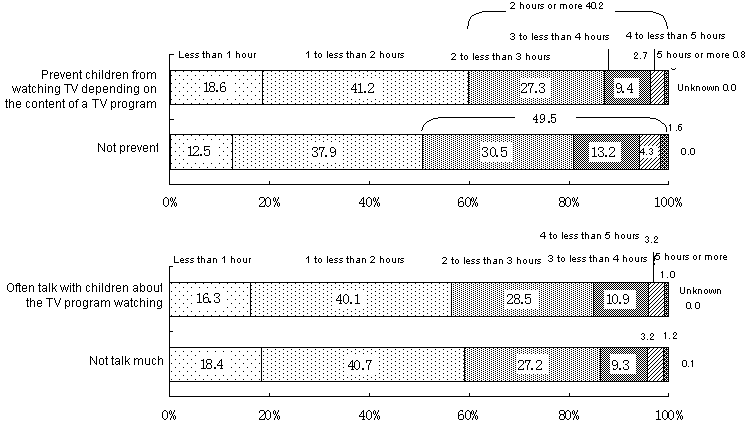
Concerning commitment to watching TV, 68.9% of respondents answered “prevent” for “prevent children from watching TV depending on the content of a TV program”. 72.2% answered “prevent” for “prevent children from watching TV for many hours continuously”, and 75.6% answered “often talk” for “talk with children about the TV program watching” (Table 7).
With regard to hours spent watching TV on ordinary days according to “prevent or not prevent children from watching TV depending on the content of a TV program”, “2 hours or more” accounted for 40.2% among respondents answered “prevent”, which was lower than 49.5% among those answered “not prevent”.
In addition, with regard to hours spent watching TV on ordinary days depending on “often talk or not talk much with children about the TV program watching”, both of hours spent watching TV for “often talk” and “not talk much” showed a similar tendency (Figure 10).
Figure 9 Changes in hours spent watching TV on ordinary days
| Notes: |
| 1) |
The figures are based on the total number of responses in the 5th and 6th surveys (total number of replies: 37,294). |
| 2) |
“Unknown” concerning hours spent watching TV in the 5th survey includes “not sure”. |
|
Table 6 Hours spent watching TV on ordinary days and Sundays
(Unit: %)
| |
Hours spent watching TV on Sundays |
| Total |
Do not
watch
TV |
Watch
TV |
|
Unknown |
Less
than 1
hour |
1 to less
than 2
hours |
2 to less
than 3
hours |
3 to less
than 4
hours |
4 to less
than 5
hours |
5 hours
or more |
Hours spent watching
TV on ordinary days |
Total |
(100.0) |
100.0 |
0.7 |
98.5 |
8.6 |
29.5 |
31.3 |
18.1 |
7.2 |
3.8 |
0.9 |
| Do not watch TV |
(1.1) |
100.0 |
18.3 |
81.0 |
54.5 |
20.7 |
4.5 |
0.9 |
0.2 |
0.2 |
0.7 |
| Watch TV |
(98.5) |
100.0 |
0.5 |
99.0 |
8.1 |
29.7 |
31.7 |
18.4 |
7.3 |
3.8 |
0.5 |
| Less than 1 hour |
(15.9) |
100.0 |
1.9 |
97.8 |
35.2 |
52.7 |
8.5 |
1.1 |
0.2 |
0.1 |
0.3 |
| 1 to less than 2 hours |
(39.9) |
100.0 |
0.3 |
99.3 |
4.9 |
44.9 |
40.2 |
8.1 |
1.0 |
0.2 |
0.4 |
| 2 to less than 3 hours |
(28.0) |
100.0 |
0.1 |
99.3 |
1.3 |
9.1 |
45.0 |
34.2 |
8.2 |
1.6 |
0.6 |
| 3 to less than 4 hours |
(10.5) |
100.0 |
0.0 |
99.2 |
0.5 |
3.4 |
10.1 |
44.8 |
29.8 |
10.5 |
0.7 |
| 4 to less than 5 hours |
(3.2) |
100.0 |
- |
99.0 |
0.2 |
1.6 |
5.1 |
11.1 |
41.2 |
39.8 |
1.0 |
| 5 hours or more |
(1.0) |
100.0 |
- |
100.0 |
- |
0.8 |
1.8 |
4.1 |
0.3 |
87.1 |
- |
| Notes: |
| 1) |
The figures are based on the total number of responses in the 6th survey (total number of replies: 38,535). |
| 2) |
The total includes “unknown” concerning hours spent watching TV on ordinary days. |
|
Table 7 Commitment to watching TV
(Unit: %)
| |
Total |
Prevent |
Not prevent |
Unknown |
Prevent children from watching TV
depending on the content of a TV program |
100.0 |
68.9 |
30.0 |
1.1 |
| |
Total |
Prevent |
Not prevent |
Unknown |
Prevent children from watching TV for many
hours continuously |
100.0 |
72.2 |
27.0 |
0.8 |
| |
Total |
Often talk |
Not talk much |
Unknown |
Talk with children about the TV program
watching |
100.0 |
75.6 |
23.5 |
0.9 |
| |
Total |
Often watch with
adults (parents,
grandparents, etc.) |
Often watch
alone or with
other children |
Unknown |
| Person with whom children watch TV |
100.0 |
60.0 |
38.0 |
2.0 |
| |
Total |
Before
around
9:00 pm |
Around
10:00 pm |
Around
11:00 pm |
After 11:00
pm |
Unknown |
| The latest time for watching TV |
100.0 |
52.4 |
28.5 |
8.9 |
1.4 |
8.8 |
| Note: |
The figures are based on the total number of responses with children who watch TV both or either on
“ordinary days” and/or “Sundays” in the 6th survey (total number of replies: 38,309). |
|
| Figure 10 | Hours spent watching TV on ordinary days according to commitment to
watching TV |
| Notes: |
| 1) |
The figures are based on the total number of responses with children who watch TV both or either on “ordinary days” and/or
“Sundays” in the 6th survey (total number of replies: 38,309). |
| 2) |
“Less than 1 hour” includes the number of responses with “do not watch TV” on “ordinary days”. |
|