Index / Next

Summary of Result
1)   Household

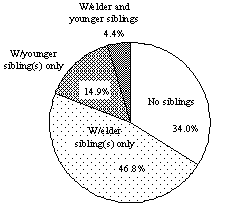
The 3rd survey subjects numbered 42,803 infants; 22,220 (51.9%) boys and 20,583 (48.1%) girls. 15.5% of them, higher than the previous survey, had new brother(s)/sister(s) during the 2nd and 3rd survey period. Although the number of only child families accounted for nearly half of the total, it dropped to 34.0% for the 3rd Survey. (Table 1, 2 and Figure 1)

The unit consisting only of "parents and siblings" accounted for 48.6%, the largest portion of the entire composition. (Table 3)

The fathers working away from home slightly increased in percentage from the previous survey. (Table 4)

Table 1   Breakdown of siblings: newly born brother(s)/sister(s)
  Total number W/younger sibling(s) (Previously reported) W/o younger sibling(s)
Increased from the 1st to 2nd Survey Increased from the 2nd to 3rd Survey
  Real numbers Percentage (%)
Total number 42 803 (100.0) 100.0 19.3 3.8 15.5 80.7
  W/ elder sibling(s) 21 898 (51.2) 100.0 8.6 1.9 6.7 91.4
W/o elder sibling(s) 20 905 (48.8) 100.0 30.4 5.8 24.7 69.6
Boys 22 220 (51.9) 100.0 19.4 4.0 15.5 80.6
  W/ elder sibling(s) 11 528 (26.9) 100.0 8.8 2.0 6.8 91.2
W/o elder sibling(s) 10 692 (25.0) 100.0 30.8 6.1 24.9 69.2
Girls 20 583 (48.1) 100.0 19.1 3.7 15.5 80.9
  W/ elder sibling(s) 10 370 (24.2) 100.0 8.4 1.9 6.6 91.6
W/o elder sibling(s) 10 213 (23.9) 100.0 30.0 5.6 24.5 70.0

Table 2   Changes in the number of siblings
(Unit: %)
   Second Survey
Total 1 (Only child) 2 3 or more
Third
Survey
Total 100.0 46.0 39.0 15.0
1 (Only child) 34.0 33.9 0.0 0.0
2 48.0 12.0 36.0 0.1
3 or more 18.0 0.1 2.9 14.9
Notes:  1)  Calculated based on total responses from the 2nd and 3rd Surveys
2)     (    )  means those who did not have any additional siblings.

Figure 1   Composition of siblings
Figure 1 Composition of siblings

Table 3   Changes in the composition of families living together
(Unit: %)
   First Survey Second Survey Third Survey
Total 100.0 100.0 100.0
Living with parents 97.6 96.9 95.9
  W/ parents, or parents & sibling(s) 76.6 75.5 74.6
  W/ parents only 38.2 35.6 26.0
W/parents and siblings 38.4 39.9 48.6
W/ parents and grandparent(s) 20.5 21.1 20.9
  W/ parents and mother's parent(s) 5.4 5.6 5.7
W/ parents and father's parent(s) 15.0 15.4 15.1
W/ parents and grandparents 0.1 0.0 0.1
W/ parents and others 0.5 0.4 0.4
Living with single parent 2.3 3.0 4.0
  W/ mother only, or mother & sibling(s) 0.8 1.2 1.7
W/ mother and grandparents, etc. 1.4 1.7 2.1
W/ father only, or father & sibling(s) - 0.0 0.1
W/ father and grandparents, etc. 0.0 0.1 0.2
Others 0.1 0.1 0.1
Notes:  1)  Calculated based on total responses from each survey
 2)  "Unknown" is included in the total number of the "composition of families living together

Table 4   Fathers working away from home
(Unit: %)
   Total Living with Living separately
Working away from home
Others (Previously reported)
Working away from home
   Working away from home
2nd Survey 100.0 97.1 1.2 0.5 2.4 1.7
3rd Survey 100.0 96.1 1.9 0.5 3.3 2.4
Notes:  1)  Calculated based on total responses from each survey
 2)  The "fathers working away from home" in the "living together" category means those who go back home periodically.


Return To Top
Index / Next