3. RISK ASSESSMENT
The risk that the there could be some BSE infectivity in non SBM tissue present in cattle slaughtered for human consumption has been assessed by combining the data and assumptions presented in the previous section in a simple “event tree”. Two measures of risk have been determined, both of which are based on the consumption of human oral ID50 units. The first measure is the total consumption per year of human oral ID50 units for all people in the United Kingdom. This is a measure of societal or group risk. The second measure is the individual risk, which is represented by the expected consumption per year by any one individual of human oral ID50 units.
For small doses, the quantity ingested provides an extremely pessimistic estimate of the risk, because of the probable existence of a safe threshold which is at present unquantified.
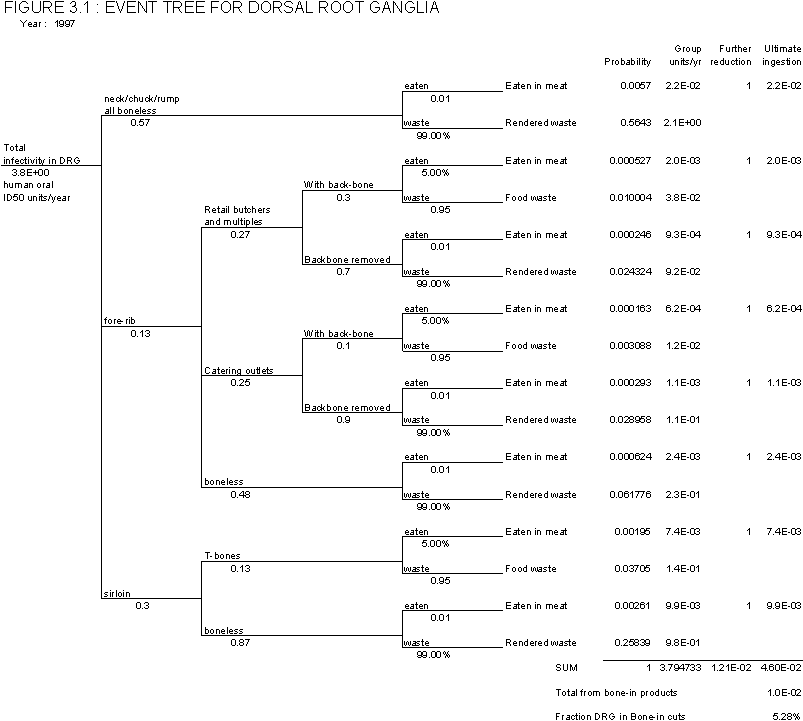
The event tree for assessing the exposure to infectivity in DRG is shown as Figure 3.1. The infectivity in the material is given on the left side of the event tree. This is simply the mass of material per animal times the infectivity density times the number of infected animals slaughtered in that year.
On the right side of the event tree there are four columns. The first of these gives the total probability for that pathway. This is simply the product of all the branch probabilities along the pathway. The second column gives the resulting total infectivity units for that pathway. This is the product of the probability in column 1 with the total input infectivity. The third and fourth columns only have values when that pathway can result in that infectivity being ingested. Column 3 is only used if there is further reduction of the infectivity, for example if the infectivity is input to another event tree. Column 4 gives the ultimate ingestion.
The risk results have been evaluated using Monte Carlo simulation in order to take account of the uncertainty in the input parameters. Each variable has been defined as a distribution of values rather than as a single point value, and the result calculated many times using a simulation program.
The definitions of the input assumptions are summarised below.
| 1 | 1% |
| 10 | 24.75% |
| 100 | 24.75% |
| 1000 | 24.75% |
| 10,000 | 24.75% |
Infectivity of BSE infected brain
Log Normal Distribution; geometric mean 10, 95% ile 100, range 1 to 1000
Number of Clinical cases < 38 months old
Poisson Distribution; Rate = 4.
Weight of dorsal root ganglia in a carcase
Normal distribution; Mean = 30g, Standard Deviation = 3g.
Fraction DRGs in Fore Ribs
Normal distribution; Mean = 13%, Standard Deviation = 1.3 %.
Fraction DRGs in Sirloin
Normal distribution; Mean = 30%, Standard Deviation = 3.0 %.
Fraction Sirloin sold as T-bone
Normal distribution; Mean = 13%, Standard Deviation = 1.3 %.
Fraction Fore Rib sold by retail butchers/multiples
Normal distribution; Mean = 27%, Standard Deviation = 2.7 %.
Fraction Fore Rib sold by retail catering
Normal distribution; Mean = 25%, Standard Deviation = 2.5 %.
Fraction backbone removed by retail butchers
Normal distribution; Mean = 70%, Standard Deviation = 7.0 %.
Fraction backbone removed by catering butchers
Normal distribution; Mean = 90%, Standard Deviation = 9.0 %.
Probability Infectivity does not remain in bone
Log normal distribution; Mean = 1%, Standard Deviation = 0.5 %.
Likelihood of Infectivity being consumed from bone-in meat
Log normal distribution; Mean = 5%, Standard Deviation = 1%.
Proportion of UK population eating beef
Normal distribution; Mean = 88%, Standard Deviation = 9%.
3.4.1 Total Ingestion of infectivity
The median value of the total ingestion of infectivity due to infectivity in dorsal root ganglia of cattle with infectivity in the CNS at less than 30 months of age, has been estimated to be 0.05 ID50 units over the whole UK population in 1997. The 95% range is from zero to 11 ID50 units, and the probability of the total ingestion being less than 1 is 80%.
The results also show that 24% of this total ingestion of infectivity is due to bone in meat (range 10% - 45%). The remainder is due to the proportion of DRG left in the meat in boning out operations.
3.4.2 Individual Risk
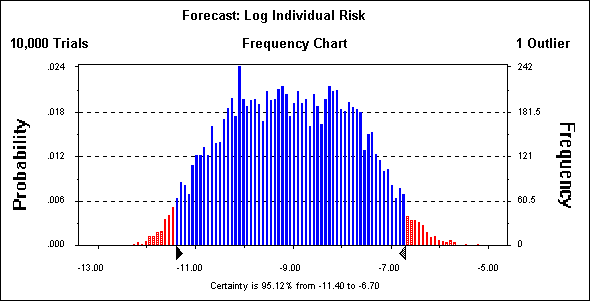
The median value of the individual risk of ingestion has been estimated to be 9 x 10⁻¹⁰ ID50 units per person per year. The 95% range is from 5 x 10-12 to 2 x 10⁻⁷ ID50 units per person per year, which is some four orders of magnitude. The frequency distribution of the log of the individual risk is shown in Figure 3.2.

The individual risk has been estimated by dividing the total infectivity ingested by an estimate of the number of people in the UK that eat beef. This could be refined by obtaining data on the numbers of people that eat certain cuts of meat (Rib roasts, T-bone steaks, etc). However it is not expected that this would make a substantial difference to the results.
3.4.3 Sensitivity
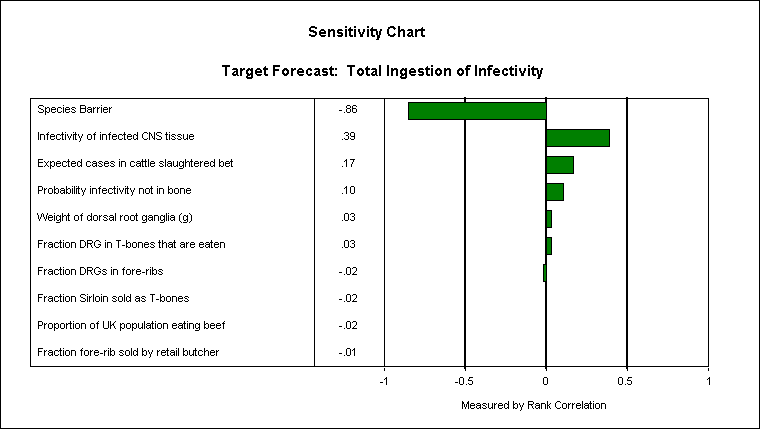
The sensitivity of the individual risk result to the individual input assumptions is shown in Figure 3.3. This shows the contribution to the overall variance from each of the input parameters. This shows that the sensitivity is dominated by the variation in the Species Barrier, which has been defined with a uniform distribution over four orders of magnitude. The next most important parameters are the estimated infectivity in infected tissue, the number of animals with infectivity slaughtered and the proportion of infectivity that is removed from the bone into the edible portion in a boning out operation.
