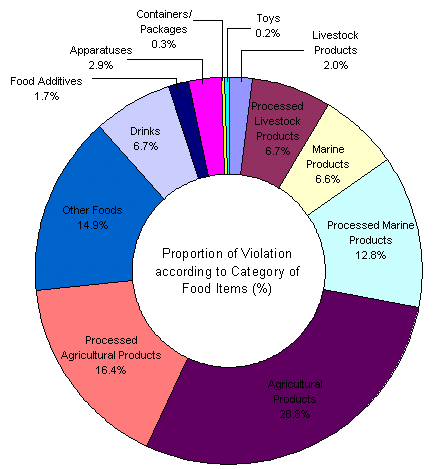
| Category of Food Items | Number of Violation (cases) |
Proportion (%) |
| Livestock Products | 21 | 2.0 |
| Processed Livestock Products | 69 | 6.7 |
| Marine Products | 68 | 6.6 |
| Processed Marine Products | 133 | 12.8 |
| Agricultural Products | 299 | 28.8 |
| Processed Agricultural Products | 170 | 16.4 |
| Other Foods | 155 | 14.9 |
| Drinks | 69 | 6.7 |
| Food Additives | 18 | 1.7 |
| Apparatuses | 30 | 2.9 |
| Containers/Packages | 3 | 0.3 |
| Toys | 2 | 0.2 |
| Total | 1037 | 100.0 |
