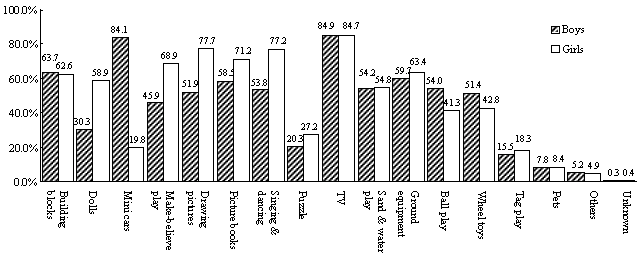
| Figure 11 | Usual recreation in the breakdown of gender (multiple answers) |

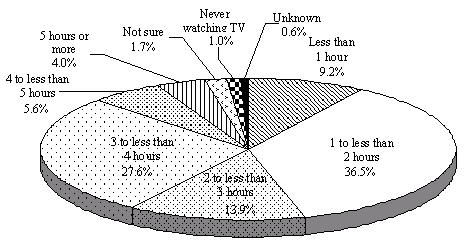
| Figure 12 | Hours spent watching TV |

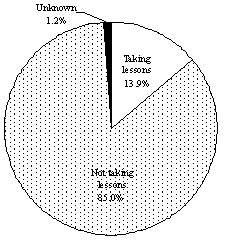
| 7) | Plays and lessons |
| Figure 11 | Usual recreation in the breakdown of gender (multiple answers) |

| Figure 12 | Hours spent watching TV |

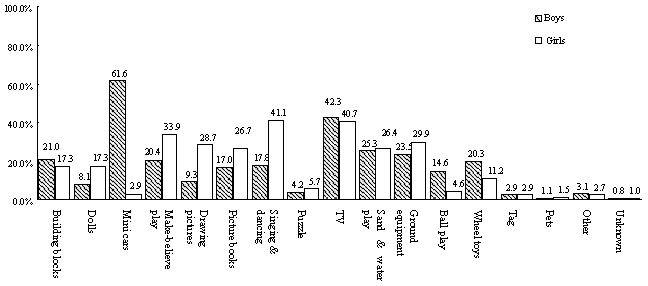
| Figure 13 | Particularly favorite forms of play (up to three) in the breakdown of gender |

| Table 13 | Usual play areas in the breakdown of dwelling types (multiple answers) |
| Total | Home garden/on the compound of collective housings | Other's home | Parks | Public equipment such as children's center | Green fields, forests, beach, etc. | On the streets | Shinto shrines/precincts of temples | Play spots in department stores or super markets | Others | Does not play other than at home | ||
| Total | (100.0) | 100.0 | 58.2 | 30.0 | 63.7 | 18.7 | 7.3 | 12.1 | 2.5 | 24.4 | 2.8 | 2.3 |
| Single family housings | (52.0) | 100.0 | 68.4 | 25.7 | 57.0 | 17.5 | 8.2 | 17.8 | 3.2 | 21.1 | 3.0 | 2.1 |
| Collective houses | (47.5) | 100.0 | 47.5 | 34.8 | 71.4 | 20.1 | 6.3 | 5.9 | 1.8 | 28.2 | 2.6 | 2.5 |
| 1-2 stories high | (13.7) | 100.0 | 54.3 | 37.7 | 65.6 | 19.0 | 7.4 | 9.3 | 2.2 | 28.9 | 2.5 | 2.2 |
| 1st or 2nd floor in the 3-5 stories high | (9.8) | 100.0 | 51.7 | 33.5 | 69.6 | 19.9 | 6.1 | 5.2 | 1.8 | 26.2 | 2.5 | 2.3 |
| 3rd to 5th floor in the 3-5 stories high | (10.0) | 100.0 | 46.7 | 33.8 | 73.8 | 20.0 | 6.3 | 4.9 | 1.3 | 28.4 | 2.7 | 2.5 |
| 1st or 2nd floor in the 6 stories or higher | (2.5) | 100.0 | 45.8 | 32.6 | 76.0 | 19.8 | 4.9 | 4.0 | 2.0 | 25.6 | 2.1 | 2.9 |
| 3rd to 5th floor in the 6 stories or higher | (5.4) | 100.0 | 34.5 | 34.3 | 79.4 | 22.0 | 4.9 | 3.9 | 1.8 | 29.3 | 3.0 | 3.0 |
| 6th floor or higher in the 6 stories or higher | (5.8) | 100.0 | 37.6 | 34.0 | 75.8 | 21.5 | 6.1 | 2.9 | 1.8 | 29.8 | 2.9 | 3.0 |
| Notes: |
|
|
|
|||||||||||||||||||||

|
|