| Note: | The figures are based on the total number of responses to the 4th and 5th surveys (total number of replies: 38,880). |
The largest proportion in terms of the number of hours spent watching TV has become gfrom 2 up to 3 hours.h
The largest proportion of children, accounting for 34.7%, watch TV (including videos and DVDs) for gfrom 2 up to 3 hours,h followed by gfrom 1 up to 2 hours,h accounting for 29.8% (Figure 8).
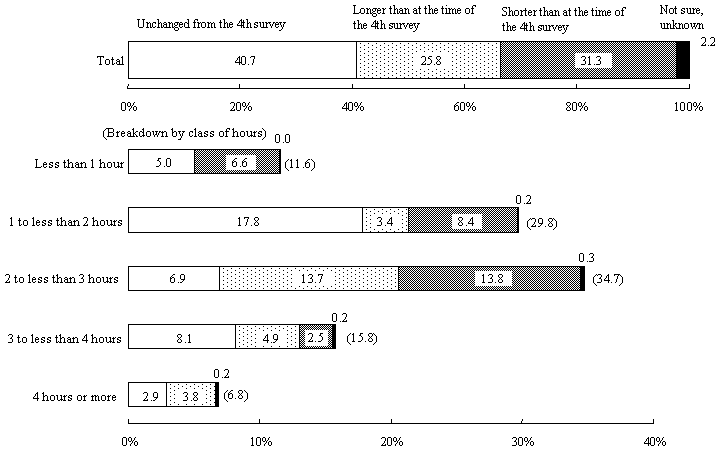
As for changes from the 4th survey, more children spend less time watching TV than those spending more time, with 40.7% unchanged from the time of the 4th survey, 25.8% spending more time and 31.3% spending less time (Figure 9).
Figure 8 Changes in the amount of time spent watching TV

| Note: | The figures are based on the total number of responses to the 4th and 5th surveys (total number of replies: 38,880). |
Figure 9 Changes in the amount of time spent watching TV from the 4th survey

| Note: | 1) | The figures are based on the total number of responses to the 4th and 5th surveys (total number of replies: 38,880). |
| 2) | Changes in the amount of time spent watching TV from the 4th survey were measured based on each category of hours in the 4th and 5th surveys. |
|
| 3) | gLess than 1 hourh includes the number of samples who gnever watch TVh. |
27.9% of children play computer games.
27.9% of children play computer games, including TV games and mobile games, 17.5% of whom gdid not play computer gamesh at the time of the 4th survey (Figure 10).
Figure 10 Changes in the status of playing computer games

| Note: | The figures are based on the total number of responses to gHours playing computer gamesh in the 4th and 5th surveys (total number of replies: 38,555). |