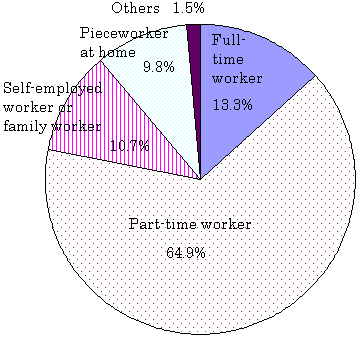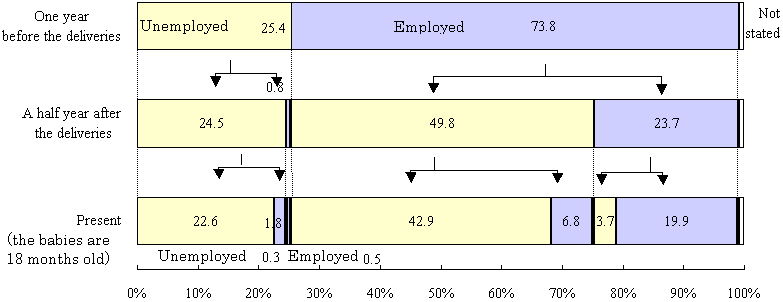
2 Employment of mothers
Table 5 Employment of mothers at the time of the first survey (one year ago) and the second survey (present)
| (unit: %) | |||||||||||||||||||||||||||||||||||||||||||||||||||||||||||||||||||||||||||||||||||||||||||||||||||||||||||||||||||||||||||||||||||||||||||||||||||||||||||||||||||||||||
| |||||||||||||||||||||||||||||||||||||||||||||||||||||||||||||||||||||||||||||||||||||||||||||||||||||||||||||||||||||||||||||||||||||||||||||||||||||||||||||||||||||||||
| Note 1: | Only the babies staying with their mothers at the both time of the first and second surveys are aggregated. | ||
| Note 2: | Total includes the number of "Not stated" of the status in employment. The number of gUnemployed'' include gNot stated of the status in job seeking'' and gStudents''. | ||
| Note 3: | In the second survey, mothers on child care leave are classified according to their employment status when they return to work. | ||
| Note 4: |
|

| Note: | Only the babies staying with their gunemployed'' mothers at the time of the first survey and gemployed'' at the time of the second survey are aggregated. |

| Note: | Only the babies staying with their mothers at the both time of the first and second surveys are aggregated. |
| (unit: %) | ||||||||||||||||||||
|
| Note: | Only the babies staying with their mothers at the both time of the first and second surveys are aggregated. |