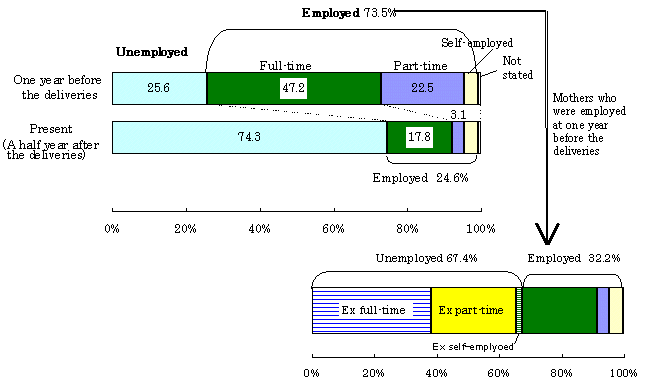
| |
One year before the delivery |
| Total |
Unemployed |
Employed |
|
| Full-time worker |
Part-time worker |
Self-employed worker
/ Family worker |
Pieceworker at home |
Others |
| Present (A half year after the delivery) |
Total |
46,961 |
|
20,926 |
25,606 |
14,872 |
8,092 |
2,016 |
424 |
202 |
| |
(100.0) |
(44.6) |
(54.5) |
(31.7) |
(17.2) |
(4.3) |
(0.9) |
(0.4) |
| |
100.0 |
100.0 |
100.0 |
100.0 |
100.0 |
100.0 |
100.0 |
100.0 |
| |
Unemployed |
34,592 |
73.7 |
96.3 |
56.1 |
49.0 |
78.9 |
18.0 |
53.5 |
52.5 |
| |
Seeking a job |
4,443 |
9.5 |
7.7 |
11.0 |
11.2 |
13.1 |
1.9 |
9.9 |
7.9 |
| Not seeking a job |
30,050 |
64.0 |
88.2 |
45.1 |
37.8 |
65.7 |
16.1 |
43.6 |
44.6 |
| Student |
99 |
0.2 |
0.4 |
0.1 |
0.1 |
0.1 |
- |
- |
- |
| Employed |
11,843 |
25.2 |
3.3 |
43.5 |
50.7 |
20.5 |
81.6 |
45.8 |
47.0 |
| |
Full time worker |
7,251 |
15.4 |
0.4 |
27.9 |
47.1 |
1.4 |
0.5 |
1.2 |
6.9 |
| Part-time worker |
1,963 |
4.2 |
1.5 |
6.4 |
2.4 |
15.6 |
1.1 |
2.6 |
0.5 |
Self-employed worker
/ Family worker |
2,019 |
4.3 |
0.7 |
7.3 |
0.8 |
1.6 |
79.7 |
1.2 |
2.5 |
| Pieceworker at home |
485 |
1.0 |
0.6 |
1.4 |
0.3 |
1.6 |
0.0 |
40.8 |
- |
| Others |
125 |
0.3 |
0.1 |
0.4 |
0.1 |
0.3 |
0.2 |
- |
37.1 |
| Number of siblings - One |
22,914 |
|
5,868 |
16,852 |
10,814 |
5,165 |
707 |
65 |
101 |
| |
(100.0) |
(25.6) |
(73.5) |
(47.2) |
(22.5) |
(3.1) |
(0.3) |
(0.4) |
| |
100.0 |
100.0 |
100.0 |
100.0 |
100.0 |
100.0 |
100.0 |
100.0 |
| |
Unemployed |
17,035 |
74.3 |
96.1 |
67.4 |
59.5 |
88.9 |
30.3 |
60.0 |
69.3 |
| |
Seeking a job |
2,416 |
10.5 |
7.3 |
11.7 |
12.7 |
11.1 |
3.0 |
7.7 |
7.9 |
| Not seeking a job |
14,540 |
63.5 |
87.5 |
55.6 |
46.8 |
77.8 |
27.3 |
52.3 |
61.4 |
| Student |
79 |
0.3 |
1.2 |
0.0 |
0.0 |
0.0 |
- |
- |
- |
| Employed |
5,640 |
24.6 |
3.4 |
32.2 |
40.2 |
10.5 |
69.3 |
38.5 |
29.7 |
| |
Full time worker |
4,078 |
17.8 |
0.7 |
23.9 |
36.8 |
0.9 |
0.4 |
- |
3.0 |
| Part-time worker |
718 |
3.1 |
1.5 |
3.7 |
2.2 |
7.5 |
0.8 |
3.1 |
- |
Self-employed worker
/ Family worker |
672 |
2.9 |
0.8 |
3.7 |
0.8 |
1.2 |
67.6 |
1.5 |
3.0 |
| Pieceworker at home |
129 |
0.6 |
0.4 |
0.6 |
0.4 |
0.8 |
- |
33.8 |
- |
| Others |
43 |
0.2 |
0.1 |
0.2 |
0.1 |
0.1 |
0.4 |
- |
23.8 |
Number of siblings
- Two or more |
24,047 |
|
15,058 |
8,754 |
4,058 |
2,927 |
1,309 |
359 |
101 |
| |
(100.0) |
(62.6) |
(36.4) |
(16.9) |
(12.2) |
(5.4) |
(1.5) |
(0.4) |
| |
100.0 |
100.0 |
100.0 |
100.0 |
100.0 |
100.0 |
100.0 |
100.0 |
| |
Unemployed |
17,557 |
73.0 |
96.4 |
34.5 |
21.1 |
61.1 |
11.4 |
52.4 |
35.6 |
| |
Seeking a job |
2,027 |
8.4 |
7.8 |
9.6 |
7.2 |
16.7 |
1.4 |
10.3 |
7.9 |
| Not seeking a job |
15,510 |
64.5 |
88.5 |
24.8 |
13.8 |
44.3 |
10.0 |
42.1 |
27.7 |
| Student |
20 |
0.1 |
0.1 |
0.1 |
0.1 |
0.1 |
- |
- |
- |
| Employed |
6,203 |
25.8 |
3.2 |
65.2 |
78.9 |
38.1 |
88.3 |
47.1 |
64.4 |
| |
Full time worker |
3,173 |
13.2 |
0.4 |
35.6 |
74.5 |
2.3 |
0.6 |
1.4 |
10.9 |
| Part-time worker |
1,245 |
5.2 |
1.5 |
11.7 |
2.9 |
29.9 |
1.3 |
2.5 |
1.0 |
Self-employed worker
/ Family worker |
1,347 |
5.6 |
0.7 |
14.2 |
1.0 |
2.3 |
86.2 |
1.1 |
2.0 |
| Pieceworker at home |
356 |
1.5 |
0.7 |
2.9 |
0.2 |
3.1 |
0.1 |
42.1 |
- |
| Others |
82 |
0.3 |
0.0 |
0.9 |
0.1 |
0.5 |
0.2 |
- |
50.5 |
|

